-
-
-
-
-
“How Long is Forever?” Alice asks in Lewis Carroll’s Alice in Wonderland, “Sometimes, just one second” The White Rabbit responds.
-
-

There exists a plethora of ways to visualize data beyond simple bar graphs, pie charts, and basic line graphs. Historians often shy away from using visualization tools, partly because of their lack of use or maybe an inherent fear of statistics.
-
Context Matters: A Data Critique of the Middlesex Convicts Delivered For Transportation 1785-92
Joshua Porter
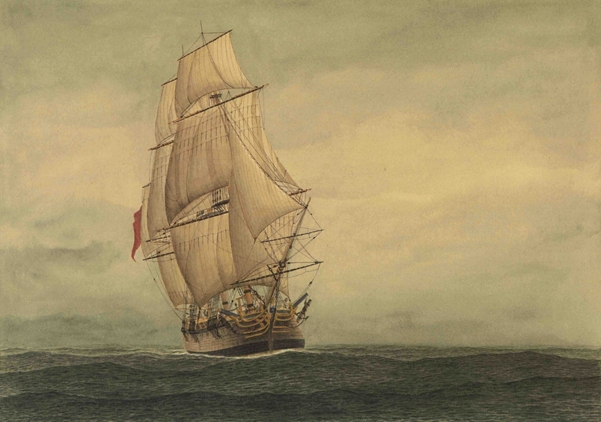
The Lady Penhryn Rows upon rows of names line the spreadsheet. In total there are fifteen-hundred and fifteen names listed and all of them are prisoners. First name, last name, maybe an alias, sex, the date that the prisoner was transferred, and to where. Fifteen-hundred and fifteen names in a column, dating between 1785 to 1792 in London, England. These prisoners and the accompanying document would likely have limited historical value if looked at in a vacuum. However, the context of these prisoners matter. Their role would build a nation and these names would become founding members to a new country.
-
Invasion of America. A Review.
by Joshua Porter
http://usg.maps.arcgis.com/apps/webappviewer/index.html?id=eb6ca76e008543a89349ff2517db47e6/. Project Director: Claudio Saunt, Russell Professor of History at the University of Georgia. Reviewed, Made for eHistory.org. Reviewed February 1-4, 2019.
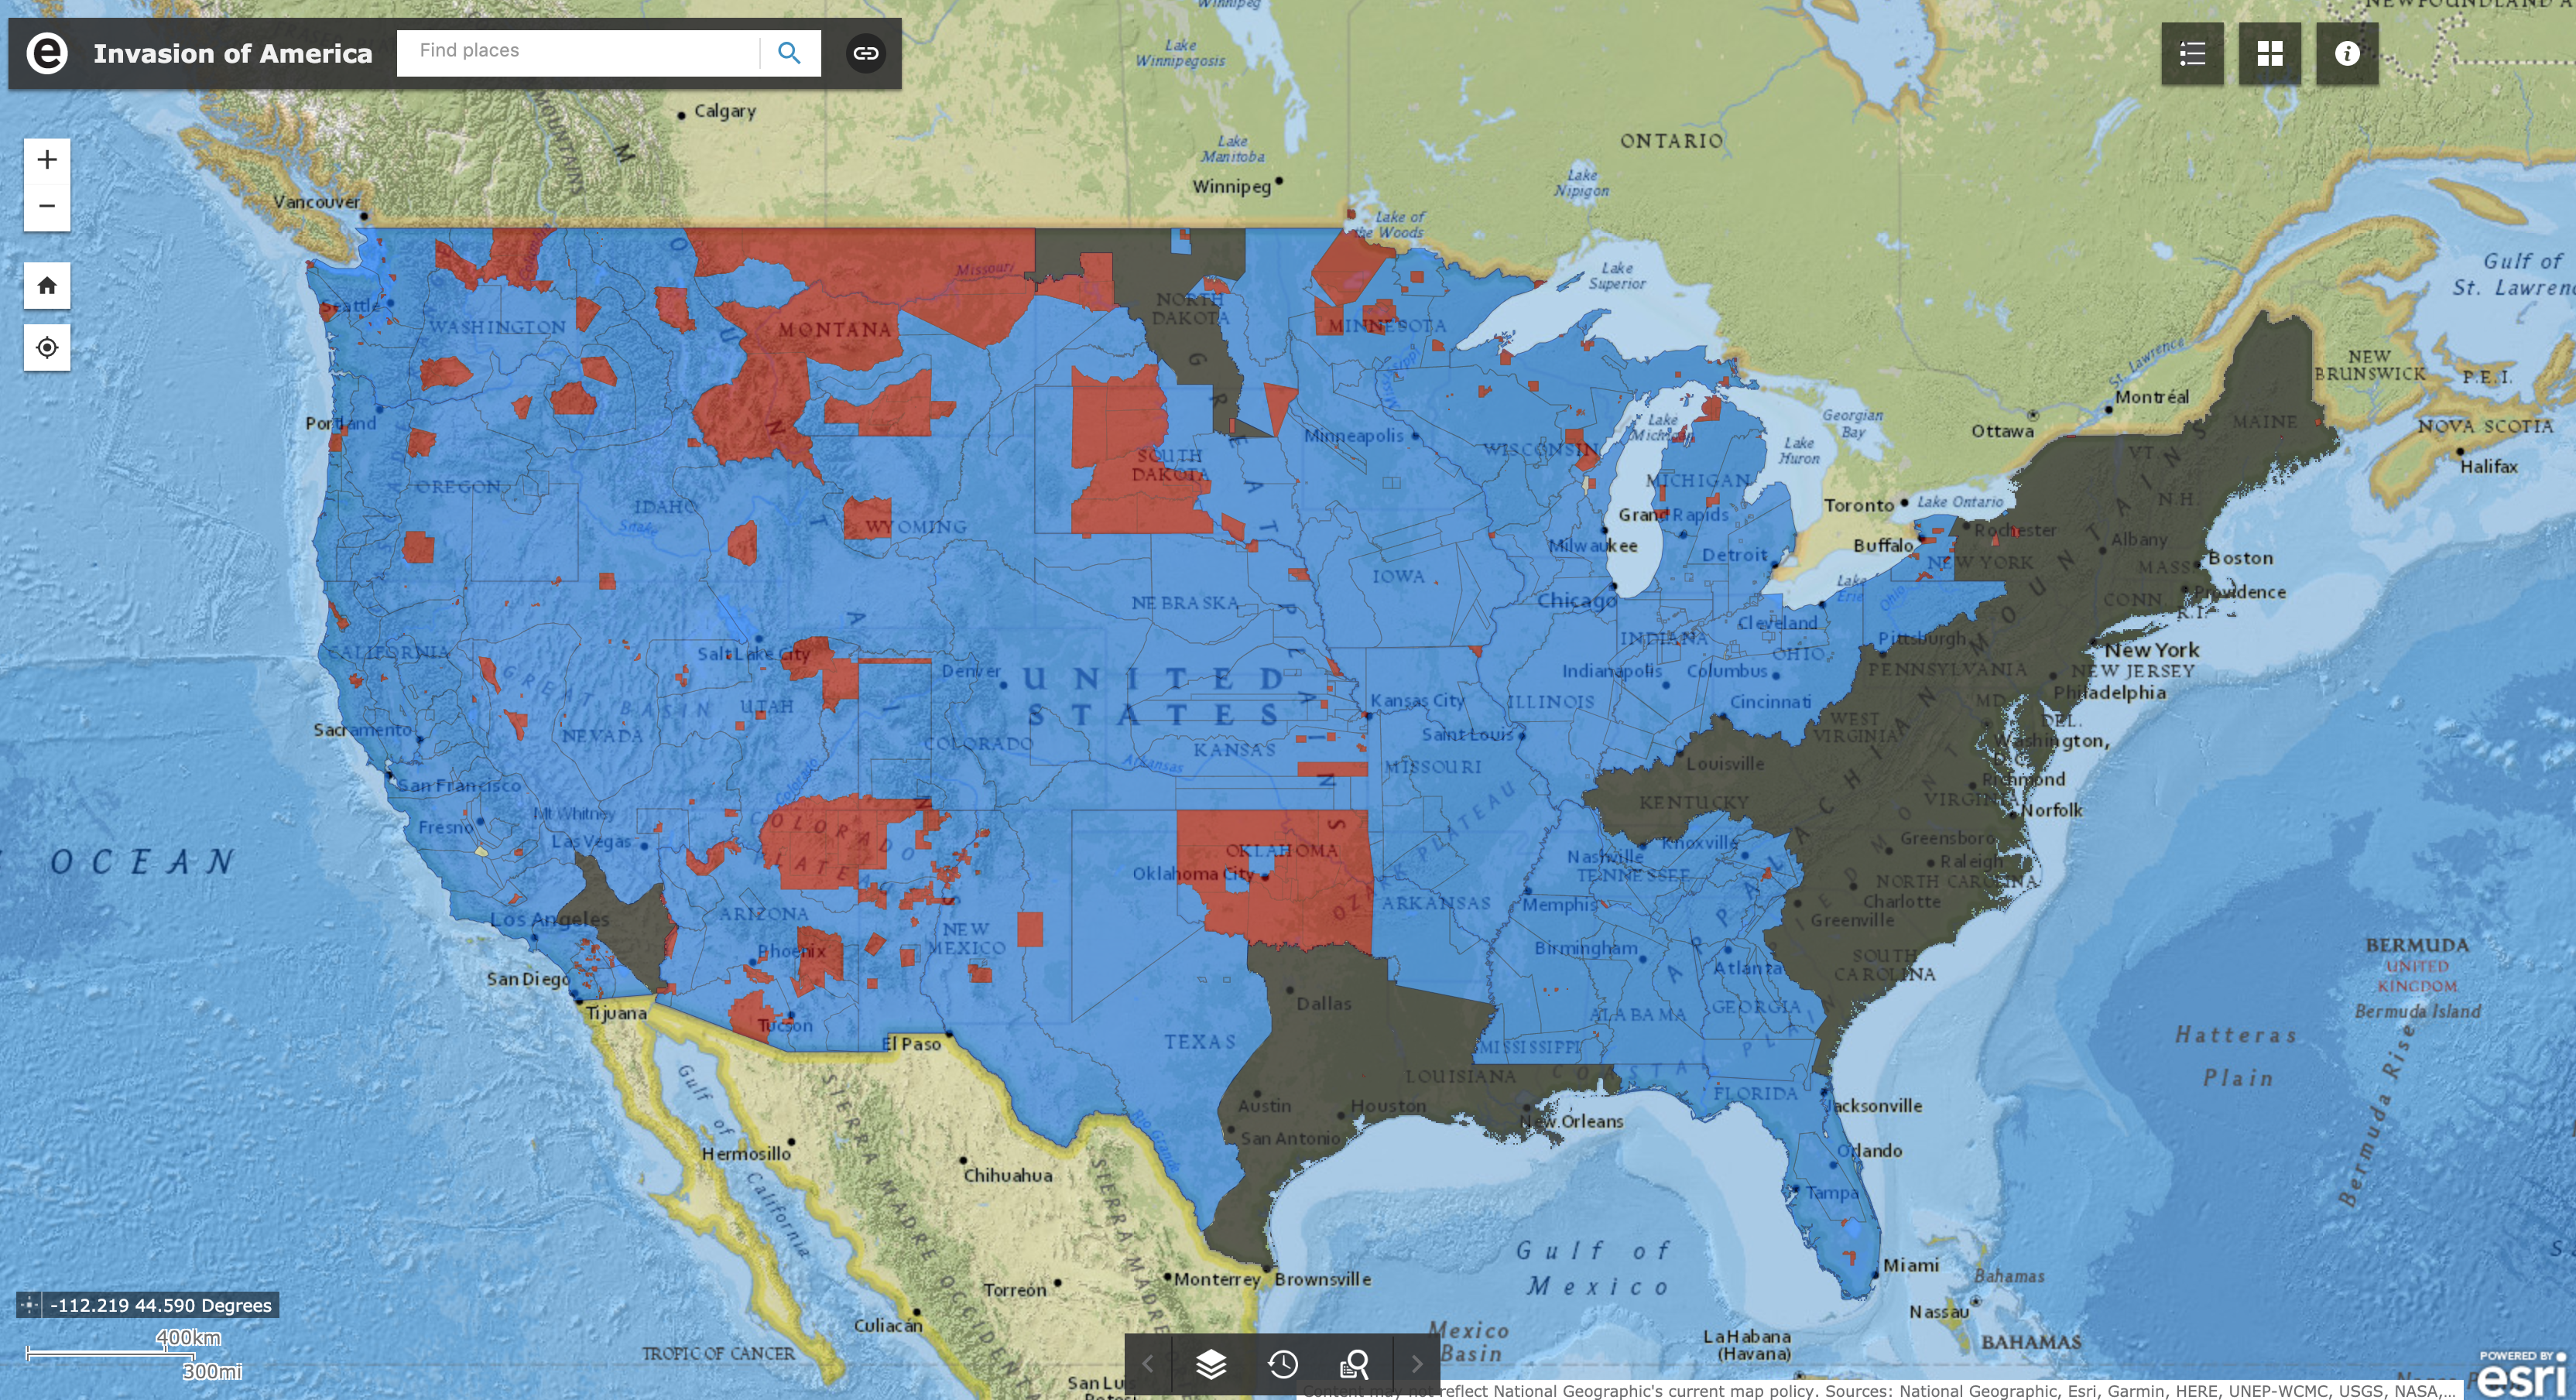
The Invasion of America The page loads and there, in blue, black, and red is the map of the United States. The words “Invasion of America” hang over the map casting a shadow against the country below. The invasion being shown is the cartographic representation of manifest destiny. The invasion by American settlers at the expense of Native Americans. The map shows how the plodding expanse of American boundaries chipped and chiseled away native lands until only blips of red remain in the ocean of blue. The project, headed by Russell Professor of History Claudio Saunt at the University Georgia, aimed to show how with each treaty and transaction the United States took over 1.5 billion acres at the expense of Native Americans.
-
Coins. A Review.
by Joshua Porter
COINS: A journey through a rich cultural collection. https://uclab.fh-potsdam.de/coins/. Created and Maintained by Münzkabinett of the Staatliche Museen zu Berlin. Reviewed February 1-4, 2019.
When I was a kid, my neighbor kept a large jug in which he would put his loose coins into everyday, until the fateful day when he would tip it over and let all the coins fall out so he could sort them, roll them, and then take them to the bank. The COINS project at Münzkabinett of the Staatliche Museen zu Berlin is the digital representation of tipping over the proverbial jug and letting the coins scatter on the digital carpet. While novel in approach, the use of the project seems stymied by how unwieldy the piles become and results in the same frustration of trying to sort through hundreds of coins on the real physical carpet.
The project opens with a massive pile of coins in the middle of your screen, however if you click on one single coin it “picks” that single coin up and details what exactly it is along with a link to the full detail page on the museums database.
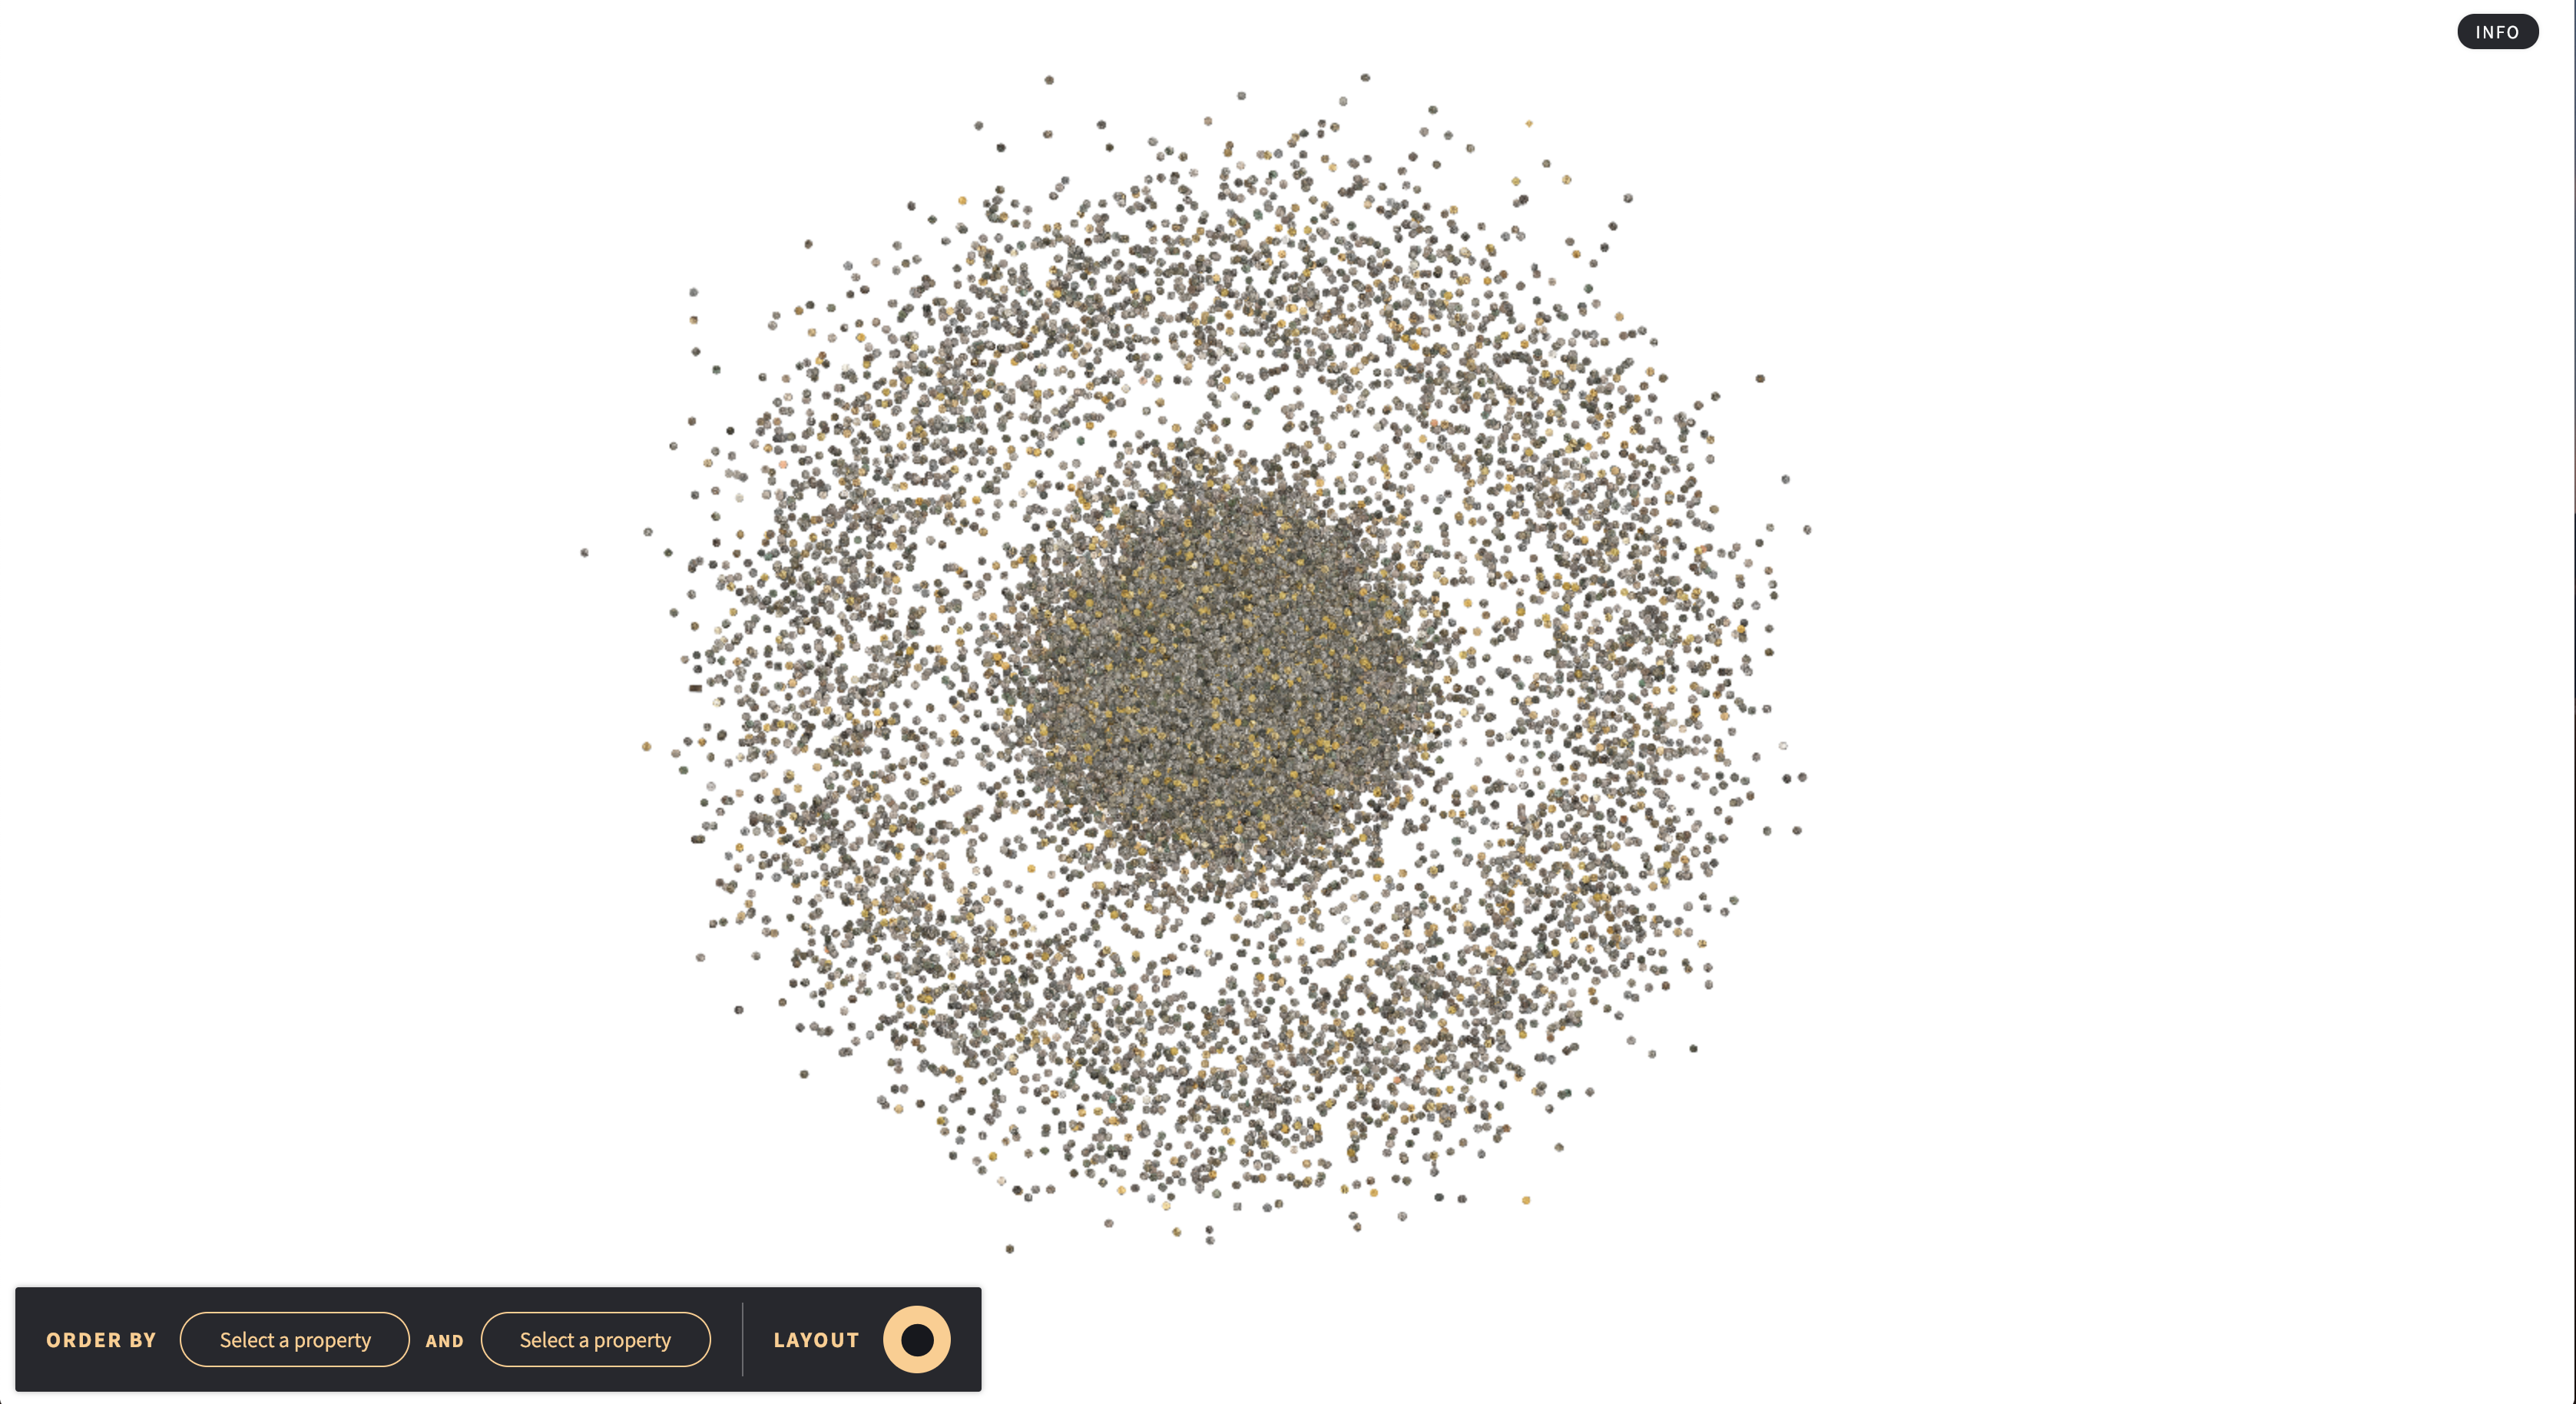
A beautiful pile of coins.