Mapping Occupation Review
“Mapping Occupation: Force, Freedom, and the Army in Reconstruction”.
http://mappingoccupation.org. Created by Gregory P. Downs and Scott Nesbit. Maintained by the University of Georgia. https://www.mappingoccupation.org/map/static/credits.html. Reviewed February 5, 2019.
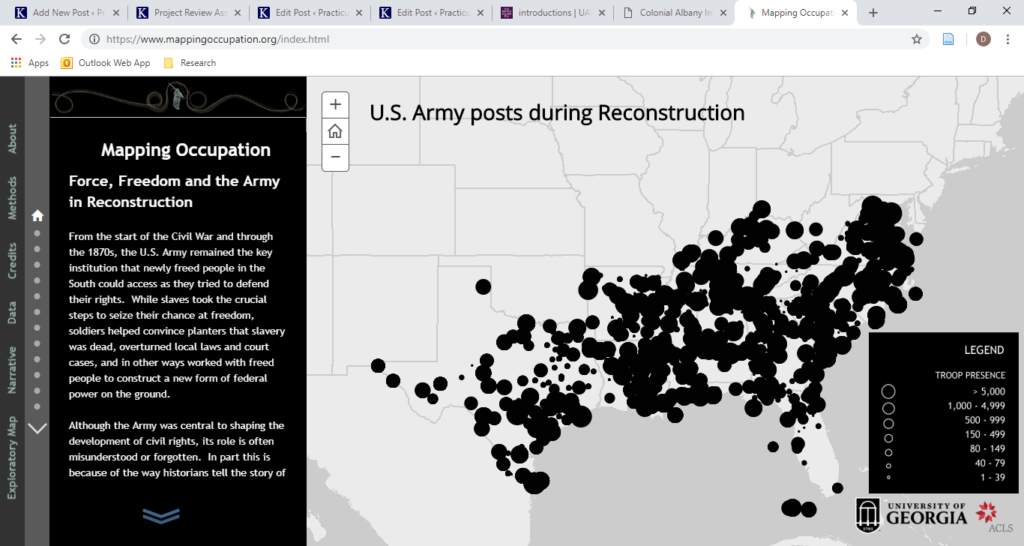
“Mapping Occupation” takes the viewer on a digital time travel journey through the years of Reconstruction following the American Civil War. This interactive mapping project by Gregory Downs of City College and Scott Nesbit of the University of Georgia visually captures to what extent the “United States Army could effectively act as an occupying force.”
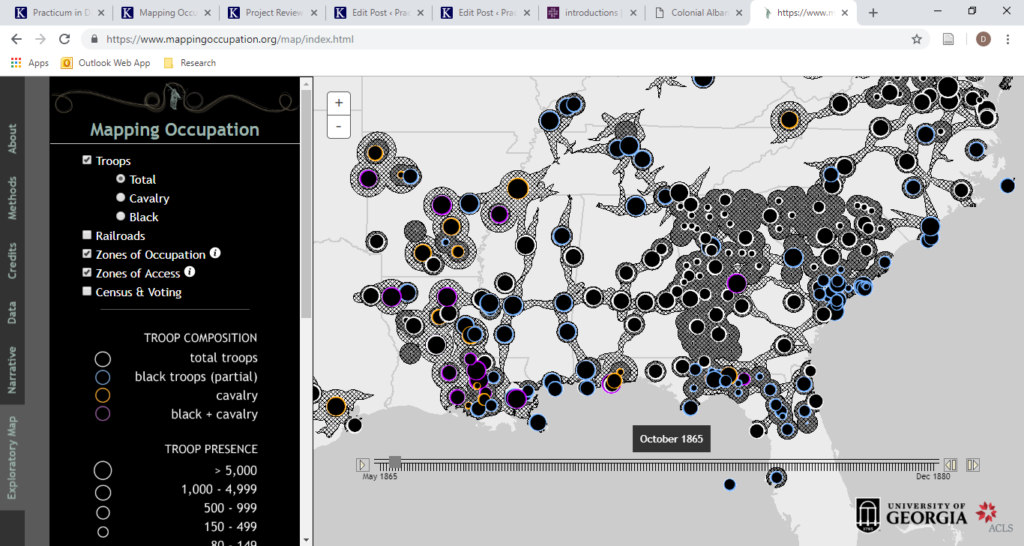
Set on a simple map overlay of the US, the program uses different size and colored dots and shading to paint the narrative of the US Army’s occupation of the South. Each dot representing a stationed force, the projects key feature is its analysis on effective zones of “operation” and “access”. Calculating the average distance that the Army or a free-person of color could reasonably travel in a day the project visually represents the range of enforcement of Reconstruction era policies at any time. Compiling these monthly data sets and scrolling through them back to back provides a narrative and spatial representation that could only be achieved in on a digital platform.
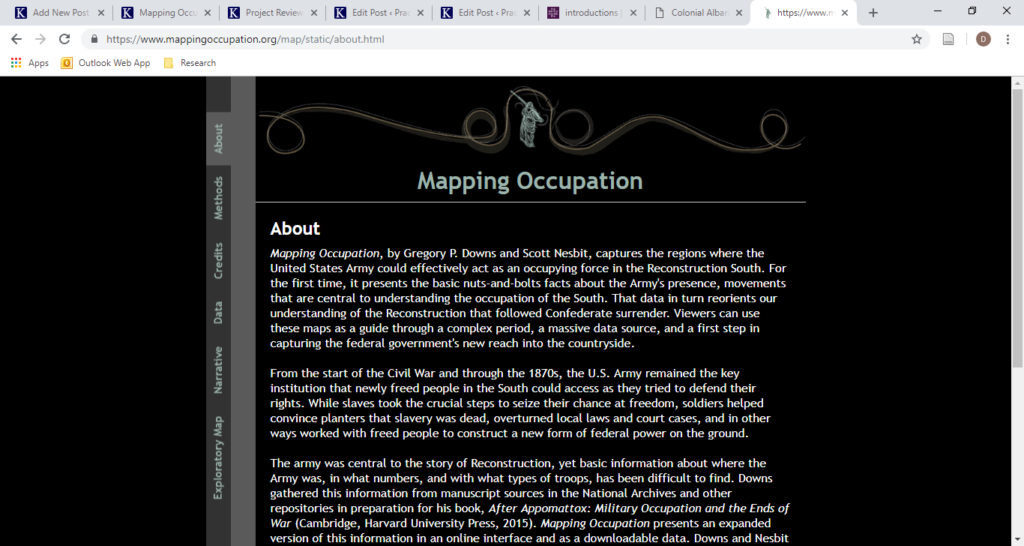
Available data filters 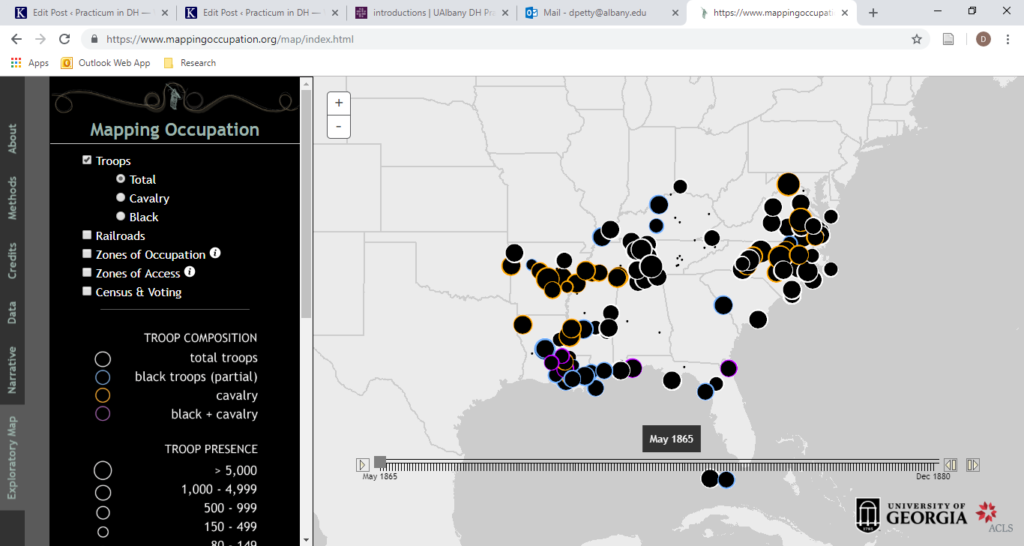
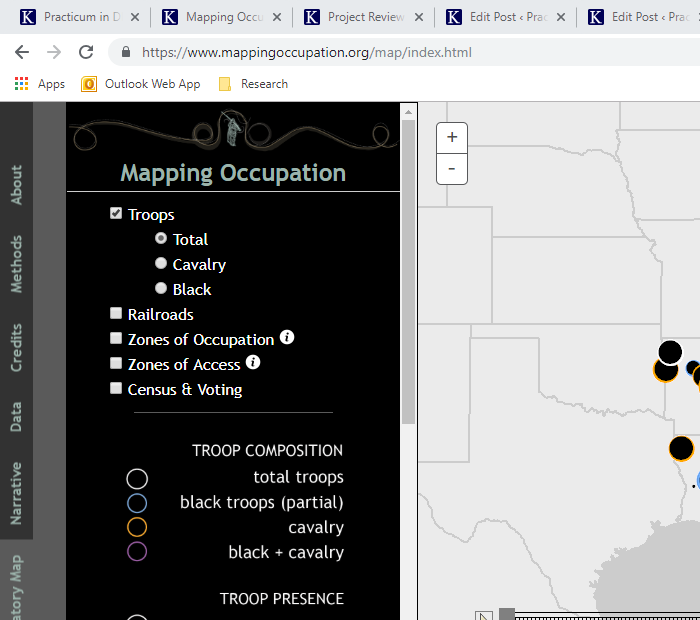
basic overlay
The data sets are simple enough to translate effectively into a lecture and the programs visual readability is as effective as any well-crafted slide presentation. Easily understandable, interactive, and started with the press of button, Mapping Occupation can be as effective a classroom teaching device as a research tool.
While the data has been curated by Downs and Nesbit into a linear narrative, beginning in 1865 and ending in 1880, the data is presented so that a researcher is not limited to such interpretation. Hovering over a data point brings the user to a more detailed set of the statistical categories including, number of Black soldiers, and Calvary stationed on base. These numbers are not required to understand the argument of the authors but provide ample opportunity for larger exploration. An interesting feature included in the map is the ability to place southern rail lines onto the map. This tool highlights the importance of infrastructure in the occupation and more importantly to the projects aim, the effectiveness of enforcement.
The project does well in obtaining its stated goals. The narrative of regional occupation is clear and effectively disseminated. One thing that is left to be desired however is an effective state by state analysis. While the project is displayed for easy visual understanding, the data is not easily comparable. Without a system in place to select multiple data points the research is left to the meticulous task of scrolling and marking each desired data set for comparative analysis themselves. While the entire data set is accessible for download, the abundance of data requires significant trimming in order to effectively form comparative sets. Overall, the projects strength lies in its narrative and readability. The project is much more of a finished piece of narrative work than an accessible set of data for continued use. An elegant presentation of cutting edge statistical analysis and historical interpretation, “Mapping Occupation” would be a welcome and powerful addition in many classroom settings.