-
-
-
Who are Yankee Whalemen?

This project trace the development of the labor force of the American whaling industry over the nineteenth century. Using the New Bedford whaling crew list database as a data set and the use of network analysis and mapping this project reveals the racial and geographic makeup of the whaling crews. This project will be structured as an interactive dashboard with multiple visualizations that change based on the input of the reader. The data will be filtered by year which will be able to be changed by a drop-down menu at the top of the dashboard.
-
Final Proposal
Outline– My final project will trace the development of the labor force of the American whaling industry over the nineteenth century. Using the New Bedford whaling crew list database as a data set and the use of network analysis and mapping this project reveals the racial and geographic makeup of the whaling crews. There has been previous research revealing the cosmopolitan makeup of the New Bedford crews, by mapping residency, skin color, rank and other metrics this anecdotal evidence will become visually apparent. Further, running a network analysis upon a select number of ships and filtering by race and residency, patterns of the crew makeups become apparent. Mapping residency onto a globe will display the specific hubs form which American whale men came from. While a network analysis of a collection of select voyages will trace the unique stories of specific crews. The whalers who sailed from New Bedford are incredibly diverse, and many crews display specific makeups. This project will attempt to verify previously known crew patterns as well as reveal others.
-
-
Networks Analysis Project
1)First, by viewing the expansions of networks by year it is apparent that the church congregation is expanding and becoming increasingly complex. As we filter through the earliest years, we see growth develop in two distinct ways. The first comes through the addition of what appears to be independent family additions with little or no connections to the larger congregation as is the case of the Tegedoonrek, Cannasswanes, and Tagwanagon clusters of 1735 and others in later years. The second seems to come through the addition individual connectors which form connections between disparate groups as is the case of Aron Oseragighte in 1735 and William Pentrop in 1738.
-
Choropleth and Heat Maps
Choropleth map uses shading and color variation to display data on a specific geographic location. This type of data visualization is most often associated with the display of population densities, income distribution, and election results. Choropleth maps are best at displaying density. By using either varying shades of a single color, transitions along a color scale, or discrete color blocks, Choropleth maps take advantage of contrast to display data on a geographic boundary.
-
Whaling Crew List Database
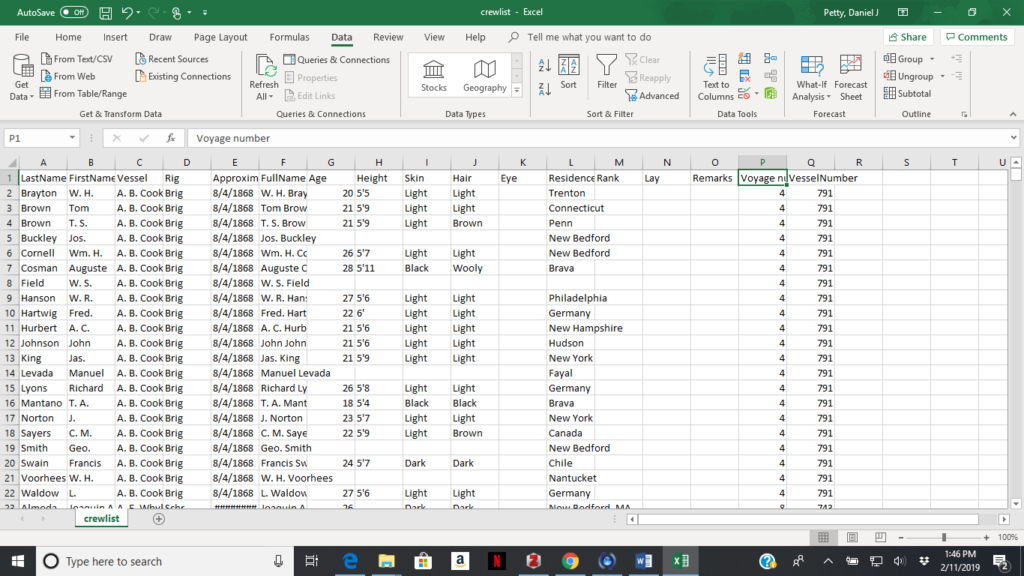
The Whaling Crew List Database is a collection of over 125,000 identification records of those who sailed from the port of New Bedford on one of the thousands of whaling voyages during the golden age of American whaling. Started by the New Bedford Free Public library through the work of volunteers and currently maintained by the New Bedford Whaling Museum the Whaling Crew List database is one of the largest collections of whalemen records in America
-
Mapping Occupation Review
“Mapping Occupation: Force, Freedom, and the Army in Reconstruction”.
http://mappingoccupation.org. Created by Gregory P. Downs and Scott Nesbit. Maintained by the University of Georgia. https://www.mappingoccupation.org/map/static/credits.html. Reviewed February 5, 2019.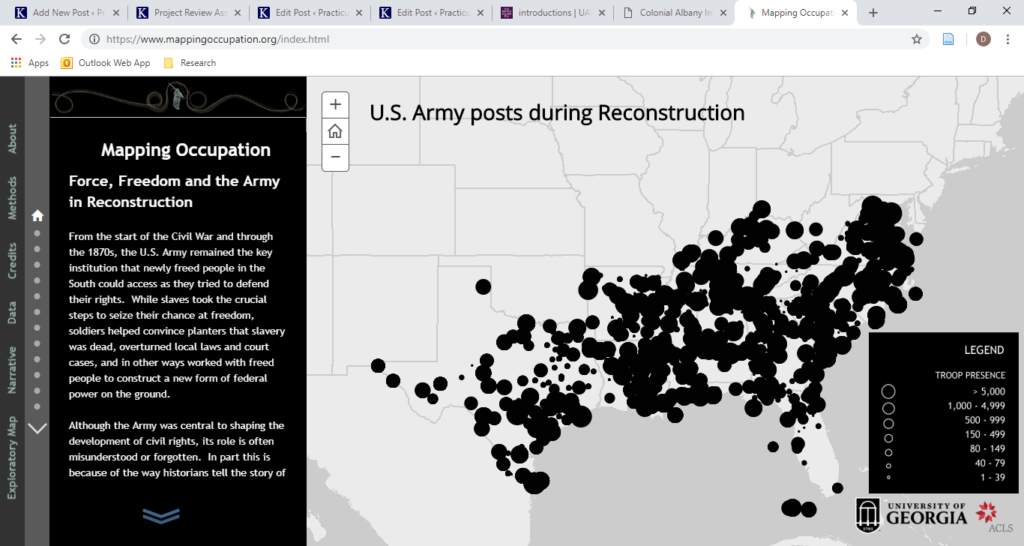
Narrative Screen of Mapping Occupation -
The People of Colonial Albany Review
“The People of Colonial Albany: A Community History Project.” https://exhibitions.nysm.nysed.gov/albany/. Created and maintained by the New York State Museum, Albany, New York, (https://exhibitions.nysm.nysed.gov/albany/whoarewe.html). Reviewed February 5, 2019.
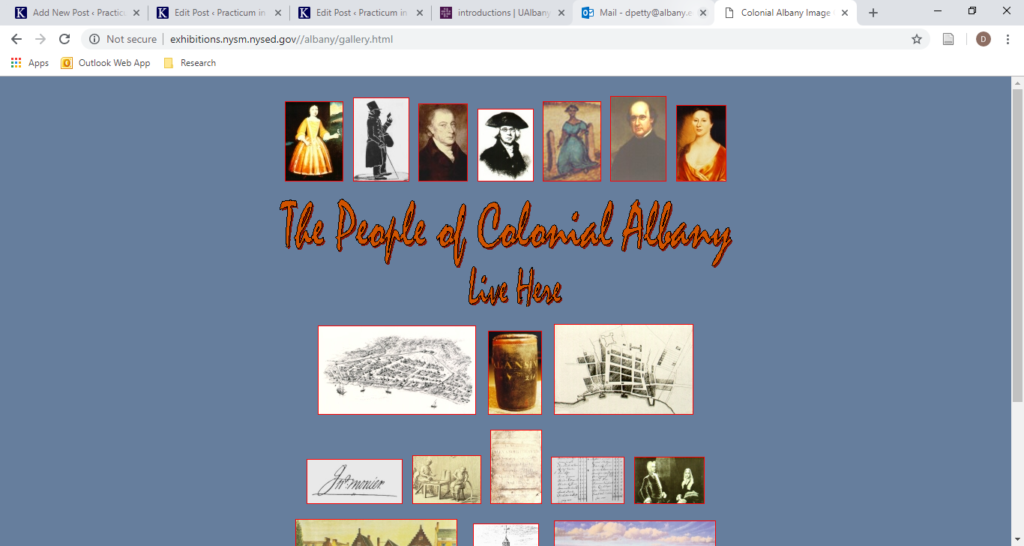
Home Screen of The People of Colonial Albany