Whaling Crews of New Bedford (Rough Draft)

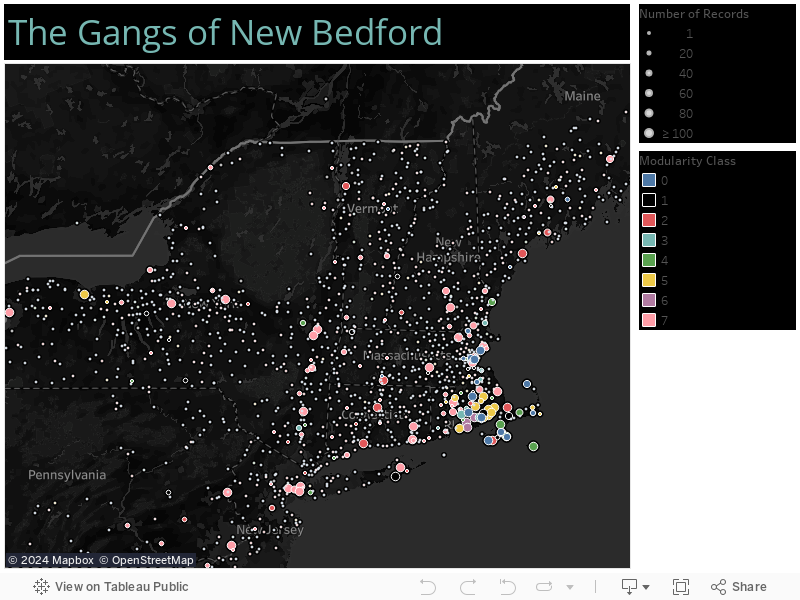
Below I am attempting to graft the modularity classes seen on the network gif onto the Tableau map so that one can see the various subgroups of whalemen sailing out of New Bedford. This will remain US centric so the sub group of Atlantic Islands will be missing. I also believe that the binning for the years is off that fix is currently in the works.
There will be a couple of different arguments made throughout this piece.
- The American Whaling industry went through a process of becoming black throughout the 19th century.
- The vast majority of sailors out of New Bedford come either from New Bedford or the North East in general. Well it is true there were people from all across the continental US and the globe on American whaling vessels much of this geographic diversity comes in the form of individual “Adventures”… Think young man Ishmael
- Whaling crews are not randomly mixed. Rather, there are interrelated networks in which certain residencies are more closely related than others(Gangs of New Bedford).
One Comment
Maeve Kane
In the first map, what do the colors signifiy? They don’t appear to be different for different places. You should either add a color key or clarify this in your tooltip. Your tooltip should also get reformatted–move the city/place name from the bottom to the top. I also suggest moving the timeline slider from the side to the top to give your map a little more breathing room, and you may also want to disable the “Show History” function since it’s on by default, and this leaves all previous results on your map, which is a bit confusing. Remember also to change your labeling from Colored to something more neutral like white/non-white. You may also want to filter out the unknowns from the “Skin Color Recorded” since the unknowns throw off the axis and don’t really contribute much. I would also relabel this graph as “Recorded Skin Color” to clarify it. It would also be helpful in that graph to have an entry in the tooltip showing just the number of records–ie, how many people does that percent represent.
The tooltip for the residency map doesn’t appear to have its pie chart–try deleting the insert code in the tooltip and re-inserting.
In the final version of this, it would be helpful to have some kind of introduction to the topic and the first big dashboard specifically.
What’s the issue you’re having with the binning? When I look at your workbook it appears to be working fine.
On the Gangs of New Bedford map, try a different color palette like Jewel Bright, and switch your borders and halo to None–I think the white border is making it hard to differentiate the colors when they get small.
In your write up for that map, it may be helpful through walking the viewer through a couple of filter actions on the map–like if you exclude the 0 modularity class, you can see much more clearly that the 0 modularity class is a global and non-New England group, but then also that modularity class 1 is New England + Hawaii, Polynesia and the Atlantic islands. Then 2-7 are much more tightly focused within the US. You can also rename your modularity classes to make that point clearer. It’s also very striking that New Orleans clusters with some Massachusetts towns!
You have Bridgehampton located over near Kazakstan–double check your lat/lon for that one.
The total foreign crew members bar graph is very interesting and I hope it makes it into the final draft. You could color that one by skin color–I think that will be an interesting part of your argument about the changing racial makeup of whalers.
The issue with the gif should be fixed. If you still want it in your dashboard, use the same url, but use https:// instead of http:// at the beginning.