Data Critiques
-
Data Critique: African Origins
In 2002 G. Ugo Nweokeji, a scholarly advisor from University of California, Berkley and David Eltis, a Woodruff Professor of History from Emory University started the African Origins project. Nweokeji and Eltis used audio recordings of names found in Courts of Mixed Commission records for Havana, Cuba and Freetown, Sierra Leone, to identify the origins of the names from different African countries and diasporas. The names documented were originally pronounced in the same language and accent. Keeping the information in it’s original state helped connect the sound of the name to its spelling. This enabled the best possible assessment of the name’s possible ethnic origins, which I believe couldn’t have been done with just written information. Eltis and Nwokeji were able to use the recordings and the pronunciations to find the closest ethnic group derived from Nigeria, Sierra Leone, Angola and parts of North America. The extensive research done created two identifications for each African in the dataset. The research done led to others wanting to volunteer and help assist with this project. The project is sponsored by Emory University, National Endowment for the Humanities and W.E.B Du Bois institute for African and African American research. African Origins contains information about the migration histories of Africans forcibly carried on slave ships into Atlantic. The data uses details of 91,491 Africans liberated by International Courts of Mixed Commission and British Vice Admiralty Courts. The data displays Africans that were liberated during the era of the suppression of the transatlantic slave trade. Names and place of origin are provided by the Africans themselves. The information helps display linguistic and geographic data on the people captured in Africa and pulled into the slave trade. It’s not easy tracing African ancestry more less locating records. This project helps links names in records produced on the American side of the Atlantic with the actual name of the African who voyaged through the 19th century. Africans that were transported in the transatlantic slave trade often had their names changed. A lot of African names became “Christianized,” once they were disembarked and sold into slavery. The knowledge of African languages, cultural naming practices, and ethnic groups helps identify these Africans’ origins just by an individual’s name. The website hopes to spark the rediscovery of the backgrounds of millions of Africans captures and sold into slavery during the transatlantic slave trading of the 19th century. You search the records by entering a African name and select a country, then specify by gender. The chart gives you the option to analyze the information up to 11 columns like: names in registers and in possible modern counterpart, ages, gender, voyage ID numbers, ship names, African ID, disembarkation port, embarkation part, language group and voyage year. The website gives you the option to pick which columns you want to see, this helps better display the information documented. Nweokeji and Eltis believe the information together with descriptions was intended to reduce the chances of re-enslavement. The African Origins project is a great database because the names of the people that were documented are, in many cases, African. There are some limits to the usefulness of this database for genealogical research because the Africans on board were liberated. So some are entered into the records of the slave trade and it’s harder for African American’s to research into enslaved ancestors. The database still displays information that will help to shed light on the ancestry of individuals descended from Africans transported in the trade or members of the African Diaspora. “
-
Shipwreck Dataset
The dataset selected was my shipwreck dataset that I have been compiling for about 15 years now. Each row represents a different shipwreck, of which there are about 400. The wrecks are ships gone missing and never found, wrecks found on the bottom and not identified, and combinations of the two. Each column, for a total of about 77, is a different set of information about the ship. Information is contained about the ship, the sinking, and the wreck. There is build info containing the time, place, and builder. There is a section on the dimensions and tonnage of the ship. Then ownership and registry info. Information about the final trip, the cause of sinking, an the general circumstances regarding the sinking. The scope of the information right now is confined to Lake Ontario as the other wrecks have been placed into a backup tab, so I can focus on a smaller subset to work with for now.
The data was generated by a combination of primary sources and secondary. Primary information comes from vessel registration documents and from newspapers clippings (digitized in the Maritime History of the Great Lakes dataset). The secondary sources consist of datasets like Bowling Green University’s online database of ship registry information or historian David Swayze’s shipwreck list on the Boat Nerd site. These are coupled with non-online sources like diving guides and archeological surveys. The dataset has been reworked and expanded several times to accommodate new information and columns like “homeport”.
-Jack Grobe
-
Albany Census 1850-1940
Owen McCarty & Sarah Scott
The data set we chose was the United States Census for the city of Albany between 1850 and 1940. The federal census is taken once every ten years, so this data set accounts for 10 censuses from the city. Because Albany is a larger city and the censuses span 90 years, the amount of data given is incredible. The Excel spreadsheet has 708,786 cells, each representing a person. Out of curiosity, I tried scrolling to the bottom manually and it took well over five minutes.
The US census began in 1790 and numbers were taken by US Marshals until the Census Bureau was formed. Because there was not overarching federal entity, much of census taking was done on the state and local level. Enumerators would go house to house and get as much information as they could. The 1850 census was the first to feature all members of the household, not just the heads of home. Given the time period, there was also a lack of technology that could be used to expedite the census taking process/counting.
-
Data Critique: George Washington’s English Imports, 1754-1772
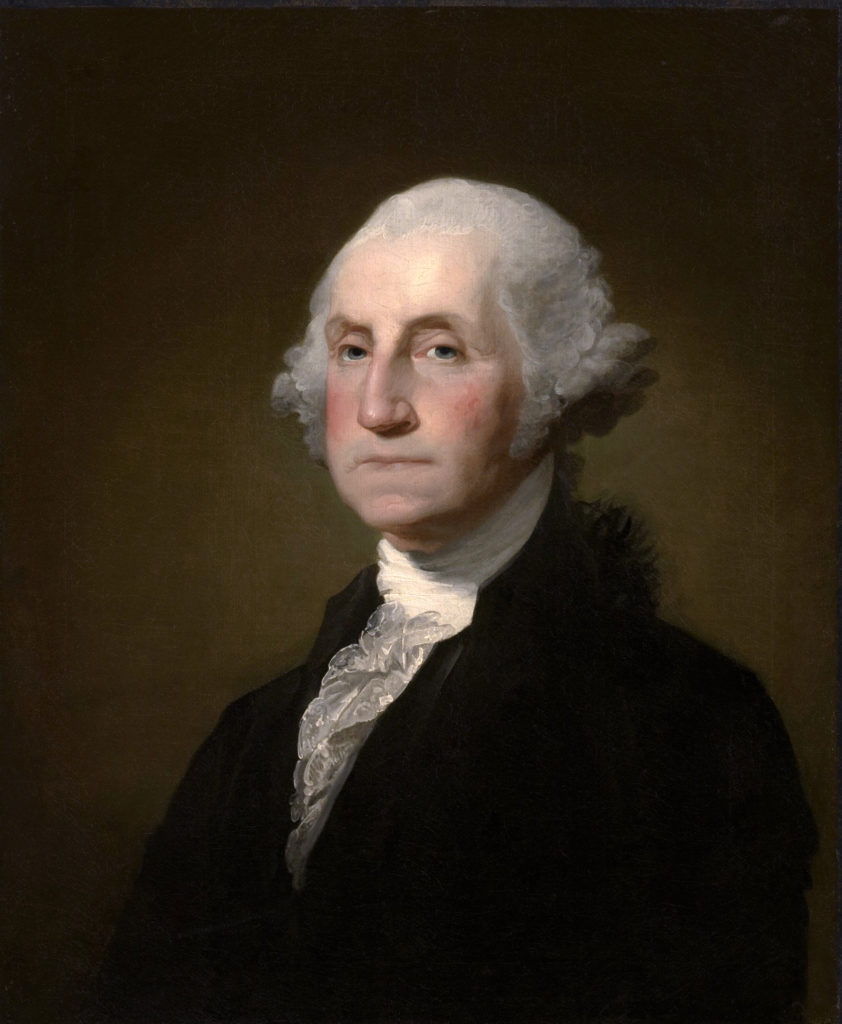
Courtesy of Gilbert Stuart [Public domain] Prior to becoming the first President of the United States, George Washington was a man of immense wealth thanks in large part to his tobacco exports to England. Wendy Lucas, of the University of Central Arkansas, and Noel Campbell, a researcher with Black, Brown, Brindle & Associates, analyzed the shipping receipts of George Washington to understand the significance of textiles in elite households in colonial America. Washington often wrote to the ‘factors’ selling his product to use the revenue and purchase goods to send to him. They chose Washington based on his high social standing and because many of his records have survived thanks to his military and political positions.
-
Data Critique: Eastern State Penitentiary Admission Records
This dataset contains information on the admission of people to Easter State Penitentiary. It includes the name, age, ethnicity, religion, birthplace, prisoner number, admission and discharge dates, offense, sentencing date and location, number of convictions, as well as several notes about the inmates. The dataset contains information about convicted criminals. The data itself is a mix of qualitative and quantitative data. The sentence length is an example of quantitative, while the offense description is qualitative. The data spans 13 years, from 1830 to 1843. Geographically speaking, it covers the Northeast United States. The scope of this data only includes convicted criminals, not the entire crime rate. This specific data shows the types of crimes committed in this region during this time period, as well as the demographics of the offenders. This data cannot show the same trends in other areas and over other time periods. It also can’t show whether the rate of crime has changed at all since earlier time periods.
A majority of the information comes from the admission records of the prison. There was also some information pulled from a report made from investigating the running of the prison. Some of the notes on the inmates were observations made by the prison’s Moral Instructor, Thomas Larcombe. These were observations about the moral states of the inmates. Information for the dataset was also pulled from letters to, from, or between the inmates.
The dataset is set up chronologically by admission date, starting with March 1830 and ending in May 1843. Each individual row contains the data for a single inmate. The columns are divided into specific information about each individual, such as their age or offense. This is likely to make it easier to compare specific data about the individual inmates. If this was the only dataset used, there would be a lot of information left out. For example, the goal of the prison was to reform the inmates, but the discharge notes don’t say whether or not that goal was reached. It also leaves out information regarding the time spent in the prison. For example, the inmate’s behavior and if or how many times they were disciplined. The data is also biased towards the prison administrators, specifically the notes about the inmates. Much of the information was recorded by the prison workers, so we’re seeing it through their observations. If this was the only dataset use, it would also leave out similar information for different time periods and areas in the United States.
-
Data Critique: Slave Sales and Appraisals, 1775-1865
Slave Sales and Appraisals, 1775-1865 is a spreadsheet created by Robert W. Fogel and Stanley L. Engerman from the University of Rochester. Utilizing probate records of slave sales and appraisals from eight southern U.S. states, currently housed at the Church of Jesus Christ of Latter-Day Saints Genealogical Society Library, Fogel and Engerman have compiled the information from these primary sources into an easily readable data set.
-
Data Critique (Aragona)
The data gathered from Transatlantic Slave ships has a wide variety of applications for a multitude of research. Scholars on Slavery, Trade, Naval movements and the Colonial period will find information detailed a separated into the following categories, Voyage ID (numbered 1-900237), name of ship’s captain, year undertaken, place of origin, destination, fate (whether that be as detailed as records of sales or as simple as disembarked.) The spreadsheet goes on to detail the end result of the journey, generally stating slaves delivered to or for original owner. From this data we can study the specifics of journeys undertaken and trace the origins of the enslaved population in certain locations. Port Documents from a multitude of nations, in a multitude of languages including English, French, Spanish, and Dutch were used to compiled the data which ranges in date from 1514 all the way through 1866. The types of records used to compile this information would have been used in a similar manner to modern cargo ship manifests, as a way to track “property” and capital. The apparent limitations in the data, likely originating from the various data sources at different ports, are demonstrated in the lack of full details beyond end results and numbers. While the presentation of data in cold numbers can be eye opening, this particular data set does very little for the ”human” side of history. We aren’t given information regarding families, or any information portraying the victims of the slave trade as anything besides numbers. Manifests like this would have been an excellent way for the ancestors of slaves to trace routes both beyond just the African continent and to separated family members had record keepers viewed them as humans and not objects. However the data kept is informative for what is present, even though what isn’t present tells an even darker story about the horrors of slavery.
-
Whaling Crew List Database
The Whaling Crew List Database is a collection of over 125,000 identification records of those who sailed from the port of New Bedford on one of the thousands of whaling voyages during the golden age of American whaling. Started by the New Bedford Free Public library through the work of volunteers and currently maintained by the New Bedford Whaling Museum the Whaling Crew List database is one of the largest collections of whalemen records in America
-
Context Matters: A Data Critique of the Middlesex Convicts Delivered For Transportation 1785-92
Joshua Porter
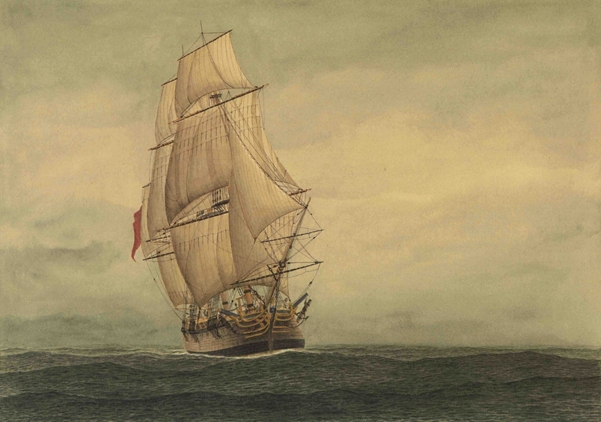
The Lady Penhryn Rows upon rows of names line the spreadsheet. In total there are fifteen-hundred and fifteen names listed and all of them are prisoners. First name, last name, maybe an alias, sex, the date that the prisoner was transferred, and to where. Fifteen-hundred and fifteen names in a column, dating between 1785 to 1792 in London, England. These prisoners and the accompanying document would likely have limited historical value if looked at in a vacuum. However, the context of these prisoners matter. Their role would build a nation and these names would become founding members to a new country.
-
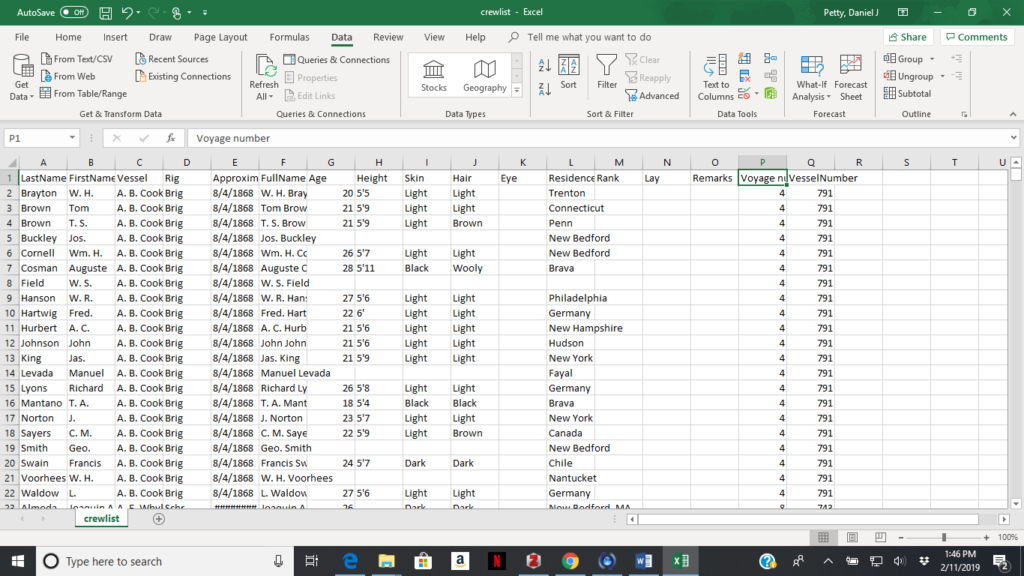
Whaling Crew List Database
This dataset was created by the Whaling Museum and the New Bedford Free Public Library and is updated once a year. This set shows all men who left New Bedford, MA on whaling vessels between the years 1809-1927. The data was originally recorded by Custom officials and was then later transcribed by chaplains of the New Bedford Port Society. Each row is an individual sailor. The columns contain the collected information about the sailors. This includes their first name, last name, and complete name, each as a separate column. Also noted is their skin, eye and hair color as well as their height and age. They included the sailors place of residence, their position on the vessel and their lay, or portion of the earnings. Also noted is the name and type of vessel, the voyage number, the vessel number and the estimated date of departure. Sometimes notes, marking a sailor’s return, desertion, death or other such information, was provided.