Review: Slave Revolt of Jamaica, 1760-1761
Slave Revolt in Jamaica, 1760-1761: A Cartographic Narrative. http://revolt.axismaps.com/map/. Created by Vincent Brown. http://revolt.axismaps.com/. Reviewed February 5, 2019.
Slave Revolt in Jamaica, created by Harvard history professor Vincent Brown, is an animated thematic map that tracks the 1760 slave insurrections in Jamaica. Beginning with the 1760 Tacky’s Revolt, Brown reconstructs the movements of three distinct rebellions that shook the British Atlantic World.
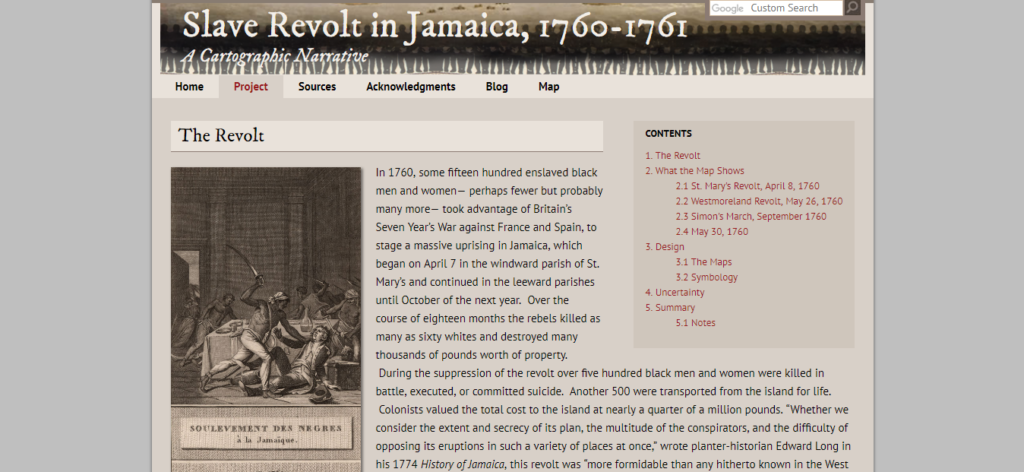
The 2012 project includes a short section that details the significance of reconstructing and analyzing the revolts over time and space, rather than through a traditional text format. Analyzing how geographic considerations and guerrilla warfare influenced the course of the failed revolt, Brown convincingly argues that viewing the Jamaican slave revolt spatially reveals the long-term plans of the enslaved to use Jamaican geography to create an, “alternative enduring society.” While traditional accounts of the revolt are often confused and entropic, Brown’s visual reconstruction reveals the role that geography played in the decisions of the insurrectionists and the British counter-insurrection. (Fig 1)
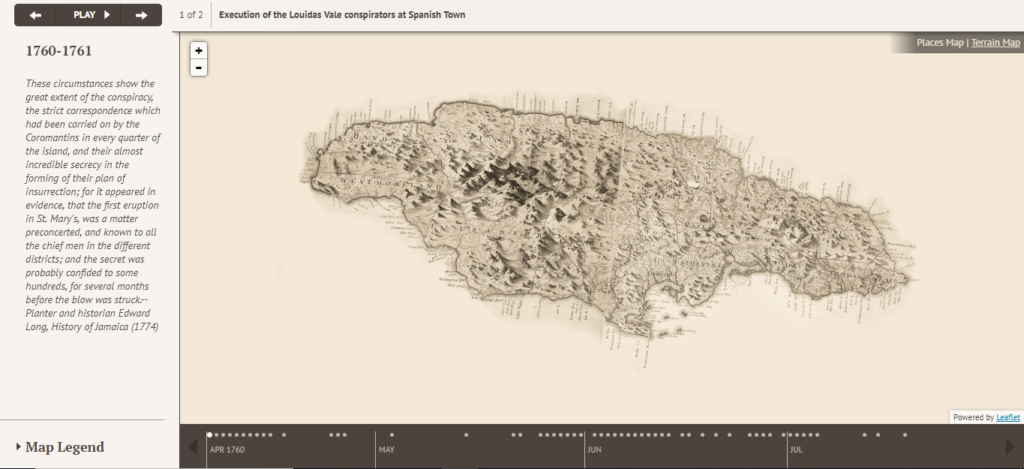
The main map section of the Slave Revolt in Jamaica is set on a timeline/map combination made with Axis Maps. While the revolt includes an autoplay feature that details the revolt over time, the map can be paused if the reader wishes to jump to different stages of the revolt. At most sections, a sidebar includes relevant quotations and sources that highlight different aspects of the currently selected event.(Fig 2)
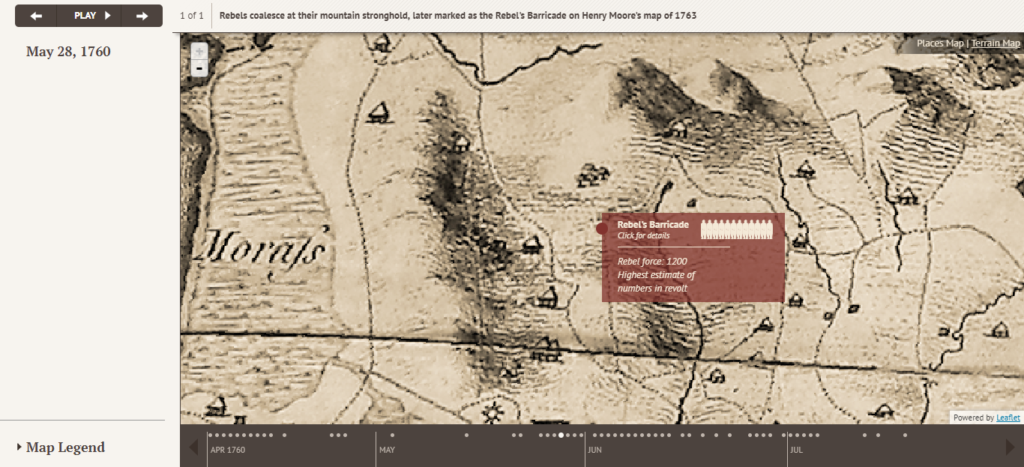
In addition to the sidebar, many of the map icons can be selected to detail the numbers of troops, casualties, and executions that took place at the time. (Fig 3) While some of the map icons and movements are confusing, Brown concludes that the chaos of the revolt and the nature of guerilla fighting pushed him to choose blurred circles and symbols to, “balance intelligibility with uncertainty, while maintaining viewers’ sense of the interpretive character of the database.”
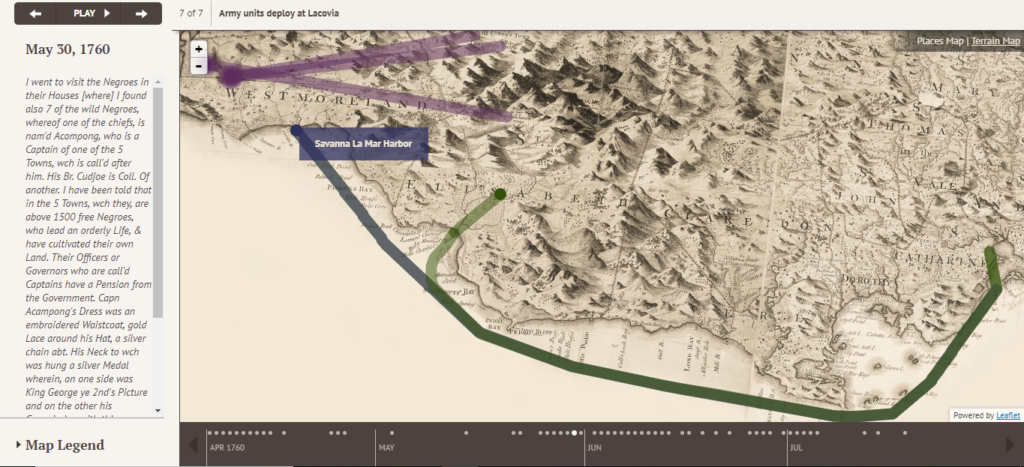
A major benefit of the Slave Revolt in Jamaica project is the visual nature of its data set. While Brown details many of his sources, it is hard to appreciate just how chaotic the revolt really was. Traditional text sources and physical maps are hard to understand in the chaos of the moment, with rumors and false reports being exchanged constantly by British colonials. By reconstructing the events visually, Brown can detail just how significant misinformation and panic was to the short-term successes of the insurrection. (Fig. 4)
Brown’s narrative focus fits a very narrow lens even with the rich, digital format. He admits that the visual nature of his data limits context surrounding the revolt and does not account for the complex social, political, and cultural world that encompassed the world of the enslaved. Nevertheless, the Axis Map representation accurately represents the military campaign’s spatial dynamics and the organizational capacities and intentionality of the insurgents. The revolt was not a series of random riots, but a well-organized military action.
One small criticism of the Slave Revolt in Jamaica project is that Brown does not fully contextualize his sources, instead relying on his audience’s prior knowledge. While the site is directed towards a more scholarly audience, a larger discussion of his sources would be a welcome addition that would make the project more accessible. At many times, the quotes in the map’s sidebar are random assortments of anecdotes without any background. While this can be confusing, it is important to remember that Brown’s primary goal is to tell a simple narrative, so the reader would do well to read the map as supplement to further research. Brown’s Slave Revolt in Jamaica is a fantastic source for studying the spatial dimensions of the 1760 insurrection and serves as a great example of how digital history can reveal historical events and intentions obscured by traditional text sources.
2 Comments
Maeve Kane
Brown’s project is a companion piece to a traditional monograph–does that change your thinking about the context at all?
Bring up the point about uncertainty in class–this is one of the big conversations in the field right now.
pricek
Not entirely. While I think that using digital formats to supplement a monograph is a fantastic way to utilize its capabilities, Brown does not make it clear that the map is supposed to be a supplement. His book, The Reaper’s Garden, and his article, “Mapping a Slave Revolt,” do add to his context, but I don’t think that he portrays his site as a companion. I think including greater context in the website or emphasizing the companion aspect would have been the correct step to avoid any misconceptions and expand his audience with relatively minimal effort. It is also important to note that the site boomed in popularity after the link was posted to a Joe Rogan website. While it is impossible to ever predict random events like this, creators should be wary in producing online content that could be taken out of context. It reminds me of our previous article, How I use Twitter as an academic: “4. Everything you say on Twitter is public and reaches lots of people you don’t know. 5. 140 characters (or 280, depending on who you are now) is very, very flattening. Assume the recipient will have the worst interpretation.” I think that Brown could not have predicted this random spike in popularity, but it is a good lesson for digital historians to keep in mind that their work can and will reach a vast number of people that will have the worst possible interpretation. With this in mind, I do think that Brown’s project is a great resource that limited its scale to a small community, but anomalies happen all of the time on the web.