Text Analysis: Microsearch, Links, Knots
By Tyson Luneau & Kristian Price
Microsearch
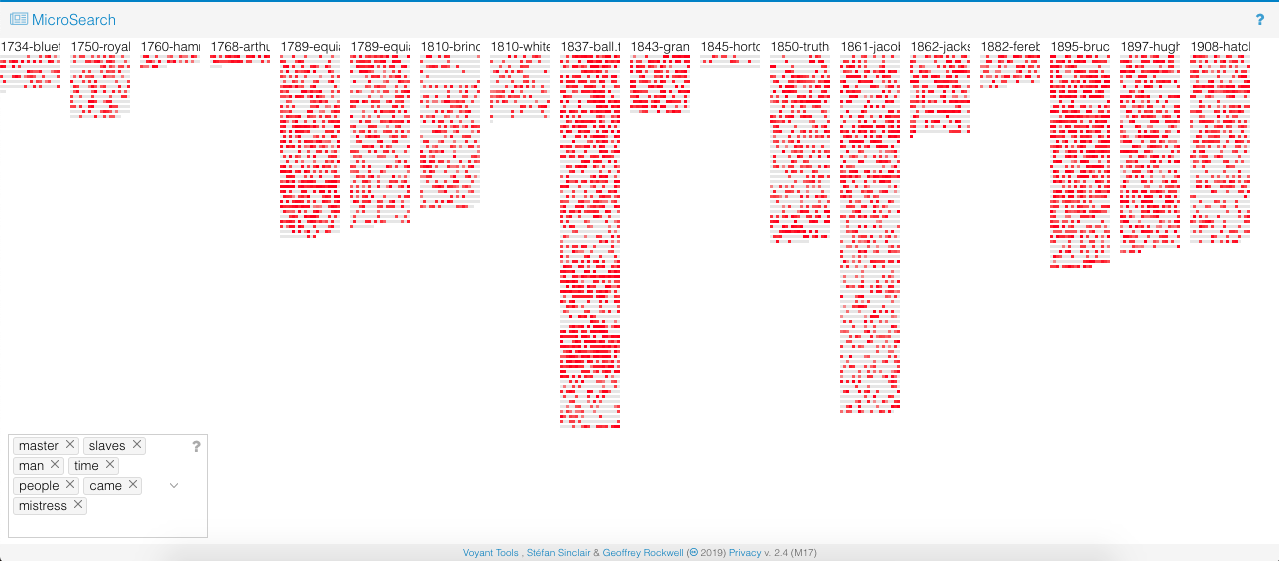
The microsearch feature can be used to analyze the frequency and distribution of terms within a corpus or a specific text. Red blocks represent the appearance of identified terms within the text, with brighter red indicating a higher relative frequency of the terms. In the 19th century slave narrative corpus, one can determine across texts where particular words appear; words that appear more frequently at the beginning or end of a text may hold some significance as compared with others.
One downfall of this visualization is that it does not distinguish between multiple terms used in the same visualization. The example below showcases the appearance of six terms we selected: time, master, man, people, slaves, mistress. All six terms appear in red, and there is no interactivity within the visualization to analyze which term or terms each block represents.
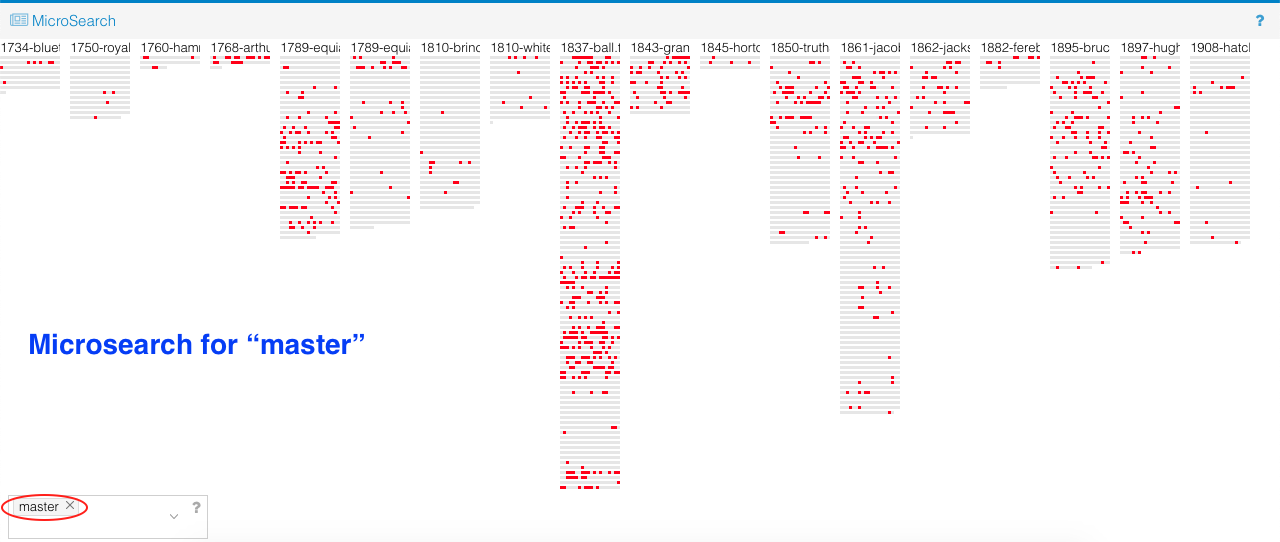
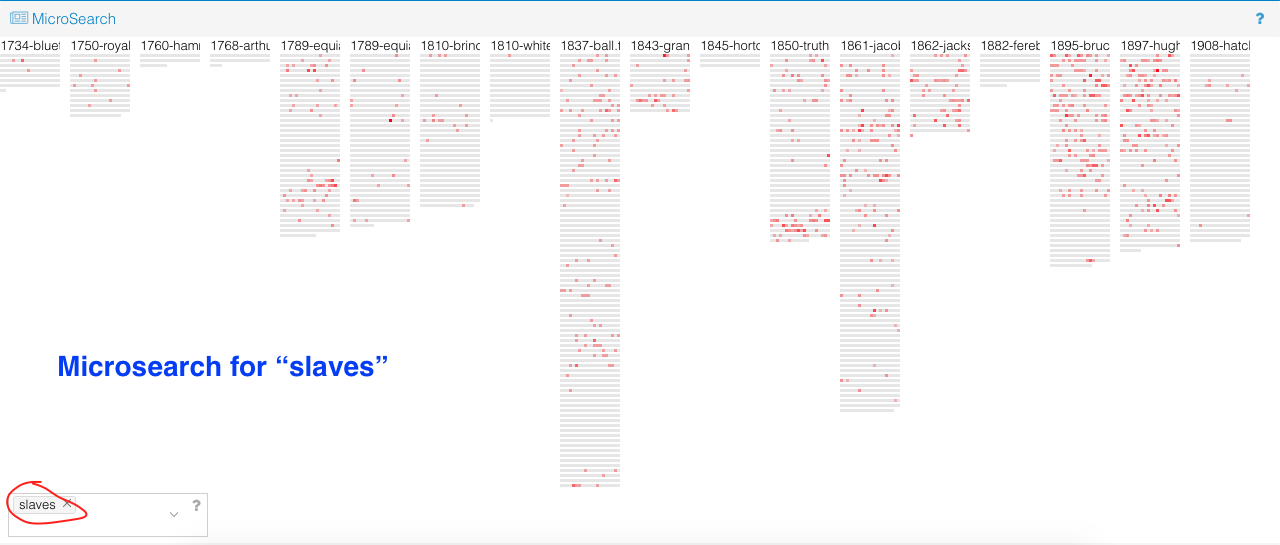
The simplest solution is to create multiple visualizations for each term or a group of terms. In the two examples below, the terms “master” and “slaves” have been isolated to show the contrast in frequency and position. By comparing these two separate visualizations, one can determine that “master” appears far more frequently than “slaves” across the corpus, with a greater concentration toward the beginning of the narratives.
Links
A simple data visualization, Links are a node-based network that show how terms are connected to eachother within a particular text. Each node on the diagram is a different word that can be added. Blue nodes are terms that the user chooses, while pink nodes are those that are closely associated with that particular term. Blue nodes vary in size based on the number of instances that the particular term appears in the text.
Link diagrams can reveal associations between words that may be hard to make by just reading the text. For example, when comparing our chosen terms, the words ‘slaves’, ‘masters’, and ‘mistresses’ reveal several interesting connections. While ‘master’ and ‘mistress’ are related to ‘said’, slave is connected to passive terms that hint at slaves as acted upon. In addition, ‘master’ also includes the verb told, while ‘mistress’ includes an association with ‘married’. Why are these terms associated with these words and what does that tell us about plantation cultures? Deeper analysis might hint at the cultural constructions of these terms and how they are used to reinforce ideal social roles for these actors.
Knots
A Knots diagram is a data visualization that represents the occurrence of a term as a series of twisting lines. Each time a term appears in a text, the line makes another turn while straight lines indicate that a term has not appeared. Lines that form a spiral shape are meant to show that a term has been repeated several times, while terms with few turns indicate that a word is used less in the text. Each visualization is based on a single text, rather than the whole collection like Microsearch and Link Diagrams.
While it can be confusing at times, Knots diagrams are a means of showing both when specific terms are used in relation to each other as well as the frequency that they are used. For example, the term ‘people’ is used in the bluett text before ‘time,’ but is used less overall. These sorts of patterns push the reader to ask why some terms appear before, or more frequently, than others. Why do master and slaves appear late in the bluett text, but appear much earlier in the Equiano-1 text? Researchers should look deeper at how the frequency of language changes between different texts, which might give clues to the importance of specific terms at different times.