-
A Geographic Analysis of Russian Economic Development, c. 1700-1913
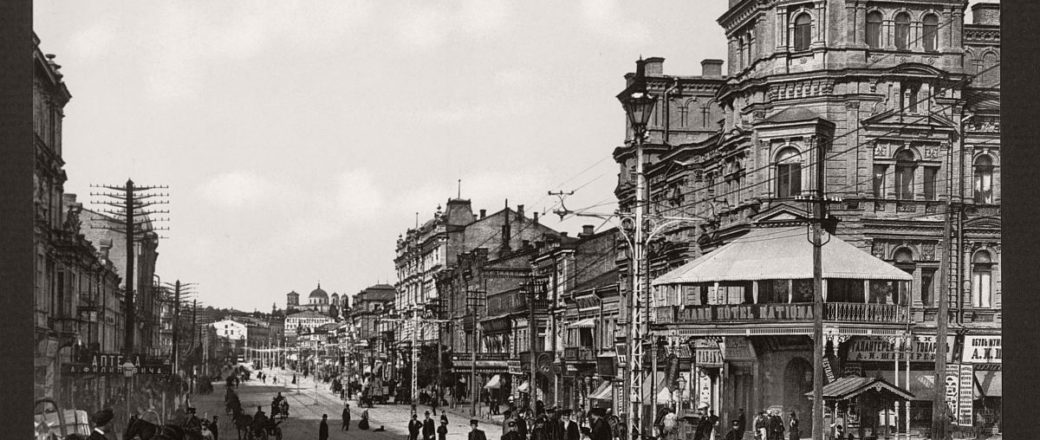
Figure 1: Kiev, 19th century (Source: Monovisions) -
Economic Development & Industrialization in the Russian Empire (Rough Draft)
Below is a “rough draft” of the data I’ve cleaned and analyzed on economic development in the Russian Empire, 1700-1913. This information was compiled using data from RUSCORP: A Database of Corporations in the Russian Empire, which contains information from the charters of over 4500 corporations within the empire in the aforementioned years. At the end, I will specify my next steps as well as elements that are currently in the works.
-
(Wireframe) A Geographic Analysis of Russian Economic Development, c. 1700-1913
Intro
This space will be used to provide context regarding Russia’s industrialization in the 19th century. This section will also address the relevant research questions:
- How did the industrialization of Russia in the late 19th century impact economic development in the borderlands of the rapidly expanding Russian Empire?
- To what extent did economic development occur outside of Russia’s industrial core regions (Central, Ural, Volga)?
- How did the diverse geography of Russia impact the development of particular industries during the late 19th and early 20th centuries?
-
Final Project Proposal: Economic Development in the Russian Empire, 1700-1913
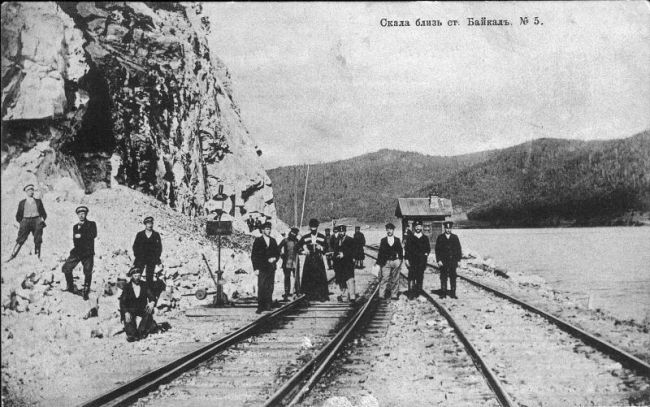
Trans-Siberian Railway, c. 1900 RUSCORP is a database of corporations in the Russian Empire founded between 1700 and 1913. The project of Thomas C. Owen at Louisiana State University, the data was compiled through the analysis of corporate charters granted by the Russian government from the time of Peter the Great until the outbreak of World War I and subsequent collapse of the Russian Empire. The database is composed of fifty-two machine-readable text files, divided into six separate file categories analyzing 4,539 corporations, 14,245 founders, and 5,243 managers. This information documents the rise of capitalism in Tsarist Russia, tracking its progress through Russia’s industrialization in the late 19th century and the demise of the empire in the early 20th century.
-
Text Analysis: Microsearch, Links, Knots
By Tyson Luneau & Kristian Price
Microsearch
The microsearch feature can be used to analyze the frequency and distribution of terms within a corpus or a specific text. Red blocks represent the appearance of identified terms within the text, with brighter red indicating a higher relative frequency of the terms. In the 19th century slave narrative corpus, one can determine across texts where particular words appear; words that appear more frequently at the beginning or end of a text may hold some significance as compared with others.
-
Networks Project
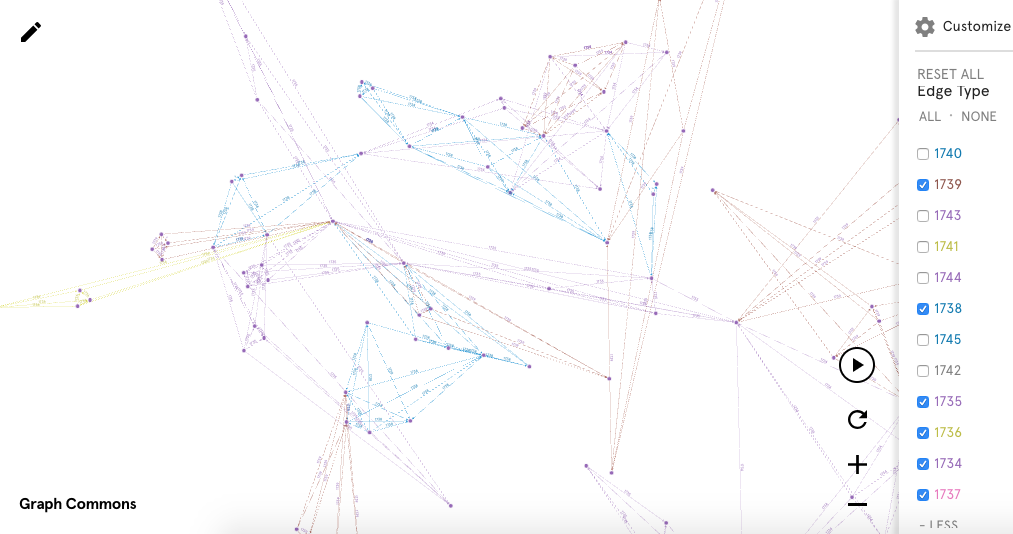
In analyzing the church congregation networks between 1735-45, the program gives the viewer the opportunity to view the vast interweaving connections between members of the congregation. In viewing the network through the filter of time, selecting subsequent years allows the viewer to witness the evolution of the complex network that existed by 1745. The first two years of the congregation consisted primarily of small, detached networks. However, as the years progress, networks become more complex: new networks are created, existent networks grow in size, and previously disconnected networks become intertwined. One benchmark year in the growth of the congregational network was 1738, when significant connections between disjointed networks were created.
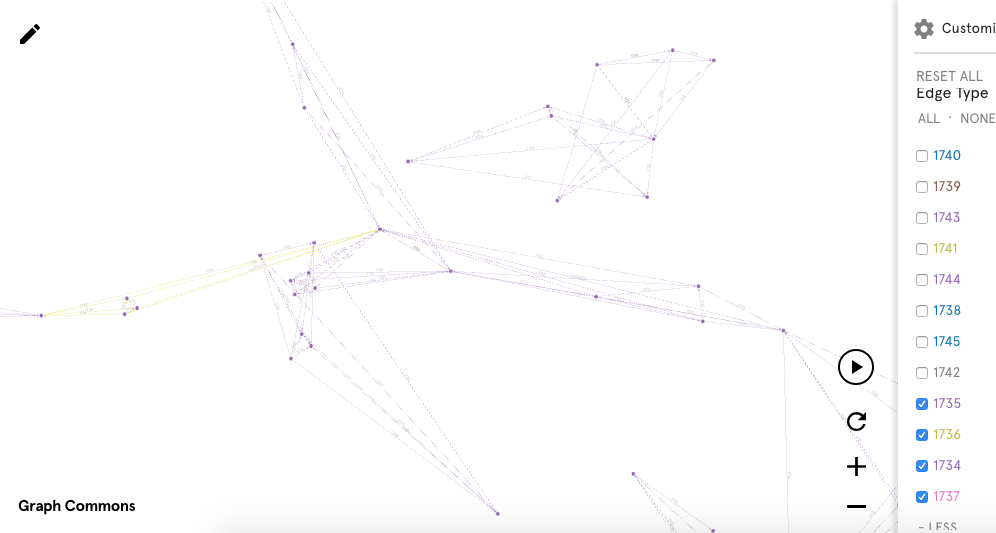
1737 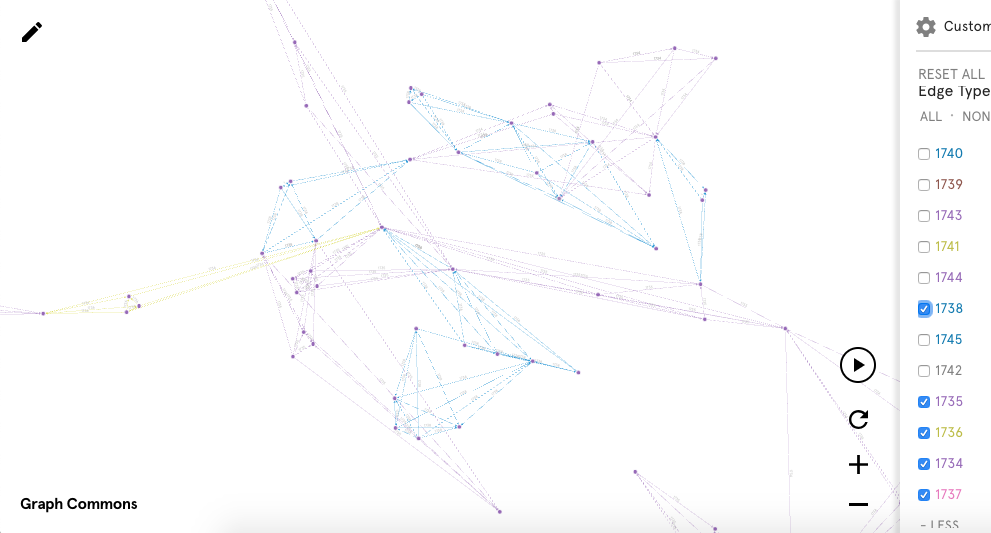
1738
The following year, 1739, was marked by increasing connections between “far away” or largely disjointed networks.
When measuring the networks by the betweenness centrality, the map becomes increasingly complex, with numerous connections across distinct nodes. These connections branch out from large “node centers” around individuals with a high degree of betweenness centrality: Anna Clement, Esras Sr, William Prentop Jr., Leut Burrows, Aron Oseragighte, and Ezras Teg are some of the more prominent figures in this view.
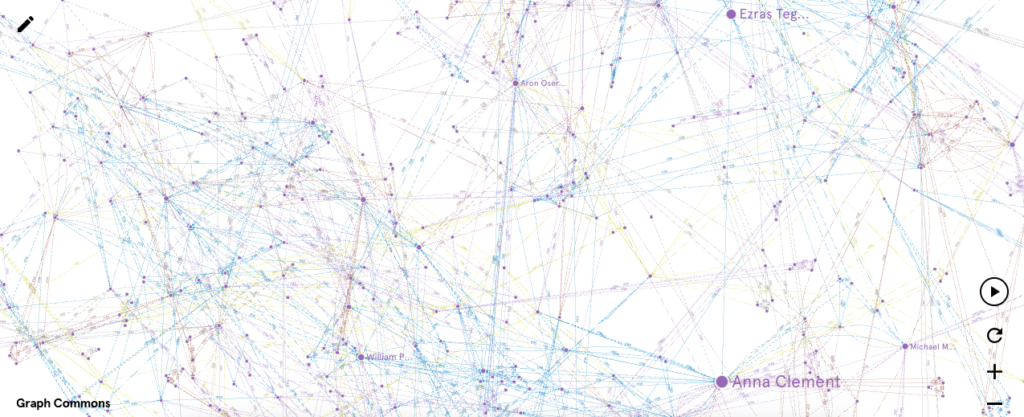
When returning to the network view based on degree centrality, many of these figures remain prominent with a number of connections to other individuals, including Anna Clement, Esras Sr, and Aron Oseragighte. However, there are others such as Mary Butler and William Mills who do not appear to have as high of a degree of betweenness centrality.
When viewing clustering patterns, many of the figures who exhibit a high degree of betweenness centrality and/or degree centrality have clusters build around them; Oseragighte, Clement, and Mills are a few examples of this. However, several other clusters form around individuals not prominent in these other views, notably Peter Young, Isaac Wemp, Abraham Canostens Peterse, and Cornelius Brown.
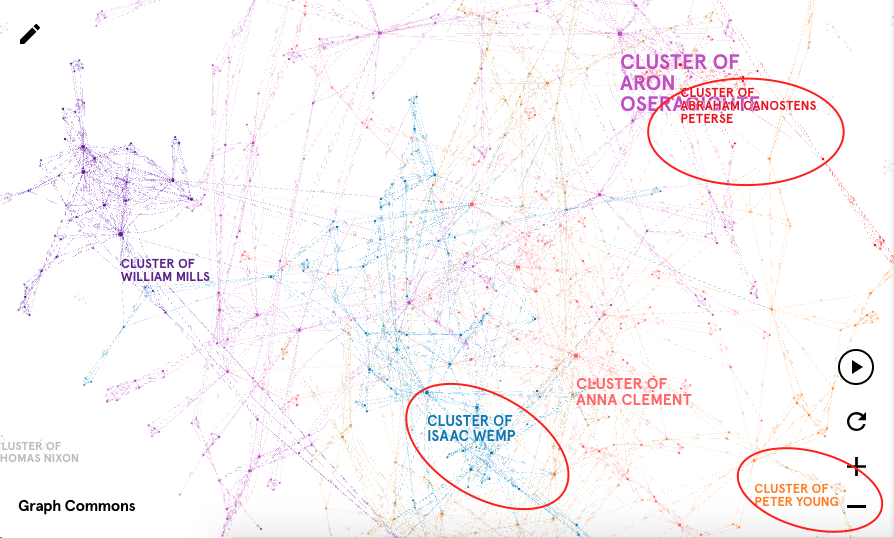
Overall, viewing these different elements of the network gives the audience an insight into potentially important or well-connected individuals within the congregation. It highlights those that are perhaps more obviously within the realm of influence or significance, as well as those whose connections might be more abstract or subtle.
-
Data Visualization: Line vs. Area Charts
When seeking to visualize data consisting of discrete points that can be measured continuously to some extent, or data that is entirely continuous, two options for data visualization are area and line charts. Though both of these formats serve similar purposes, there are notable differences in their optimal usage, particularly when attempting to represent multiple sets of data within one visualization.
-
Data Critique: Trans-Atlantic Slave Trade Voyages Database
by Tyson Luneau and Kristian Price
The Trans-Atlantic Slave Trade Voyages Database includes records of 36,002 voyages which engaged in the sale and purchase of African slaves. The recorded voyages in the database begin as early as 1514, with the last voyage occurring in 1866. There is no one distinctive, geographic pattern of these voyages, with ships traveling between Africa, Europe, and the Americas, occasionally not traveling between continents but rather from colony to colony, avoiding the middle passage altogether. Some of the voyages identified did not even contain slaves on the ship, as the captain and crew simply returned to their original ports. While some of these instances could be considered statistical outliers, it nonetheless reflects the diversity of data within the dataset.
-
Review: Foreign-Born Population, 1850-2010
Review: Foreign-Born Population, 1850-2010
Foreign-Born Population, 1850-2010. https://dsl.richmond.edu/panorama/foreignborn/#decade=2010. Created and maintained by the Digital Scholarship Lab at the University of Richmond, https://dsl.richmond.edu/panorama/. Reviewed February 3, 2019.
Foreign-Born Population, a segment of the American Panorama project created by the Digital Scholarship Lab at the University of Richmond, is a project centered around an interactive map documenting migration and settlement of foreign-born peoples across the United States. The data, gathered from the Minnesota Population Center’s National Historical Geographic Information System, is displayed for every county of every state in the nation spanning each decade from 1850 to 2010.
-
Review: Virtual St. Paul’s Cathedral Project
Virtual St. Paul’s Cathedral Project
Virtual St. Paul’s Cathedral Project: A Digital Re-Creation of Worship and Preaching at St. Paul’s Cathedral in Early Modern London. https://vpcp.chass.ncsu.edu/. Created and maintained by various departments at North Carolina State University. https://vpcp.chass.ncsu.edu/project/production-team/. Reviewed Feb. 3, 2019.
The goal of the Virtual St. Paul’s Cathedral Project, as outlined in its purpose statement, is to explore public preaching in early modern London through the experience of the Paul’s Cross sermon. Using architectural modeling, acoustic simulation, artistic renditions of the sermons, and contemporary accounts of John Donne’s preaching style and structure, this project attempts to recreate the experience of witnessing one of the many public sermons given at St. Paul’s in the early 17th century.