Economic Development & Industrialization in the Russian Empire (Rough Draft)
Below is a “rough draft” of the data I’ve cleaned and analyzed on economic development in the Russian Empire, 1700-1913. This information was compiled using data from RUSCORP: A Database of Corporations in the Russian Empire, which contains information from the charters of over 4500 corporations within the empire in the aforementioned years. At the end, I will specify my next steps as well as elements that are currently in the works.
The primary aim of this project is to trace the development of industry in the Russian Empire between 1700 and 1913, with a particular focus on the peripheral regions of the empire. It is most commonly assumed that the vast majority of Russia’s economic development, particularly its industrialization in the latter half of the nineteenth century, took place in the so-called “Russian Heartland,” a term used to refer to the core regions of Central Russia, Northwestern Russia, the Volga Region, and Southern Russia. While there is undoubtedly a degree of accuracy to this statement, this projects seeks to explore the degree to which economic development occurred in Russian borderlands, what types of industries developed in these areas, and the level of investment that was put into corporate activities in the empire’s periphery.
For the purposes of this project, I have identified fifteen regions within the Russian Empire. It is noteworthy that not all regions were under the rule of the Russian Empire for the entirety of the identified time period, which is reflected in the temporal aspect of Russian corporate development. Nonetheless, even regions outside of the domain of Russian rule were often subject to considerable Russian influence, with the empire serving as a dominant economic power in Eastern Europe, the Caucasus, and Central Asia for most of its existence. The identified regions of the Russian Empire are the Arctic, Baltic Region, Belarus, Caucasus, Central Asia, Central Russia, Crimea, Far East, Northwestern Russia, Poland, Siberia, Southern Russia, Ukraine, Ural Region, and Volga Region.
Additionally, Russian corporations developed bases of operations outside of the empire itself, reflecting a degree of foreign investment on the part of Russia. Regions outside of the Russian Empire in this database include Africa, the Balkans, East Asia, Western and Central Europe, Scandinavia, South Asia, and Western Asia.
One measure by which the spread of capitalism in the Russian Empire can be analyzed is through the locations of corporate headquarters. While this view does not give a complete analysis of Russian economic activity, it does help to identify the primary regions of Russian commercial development.
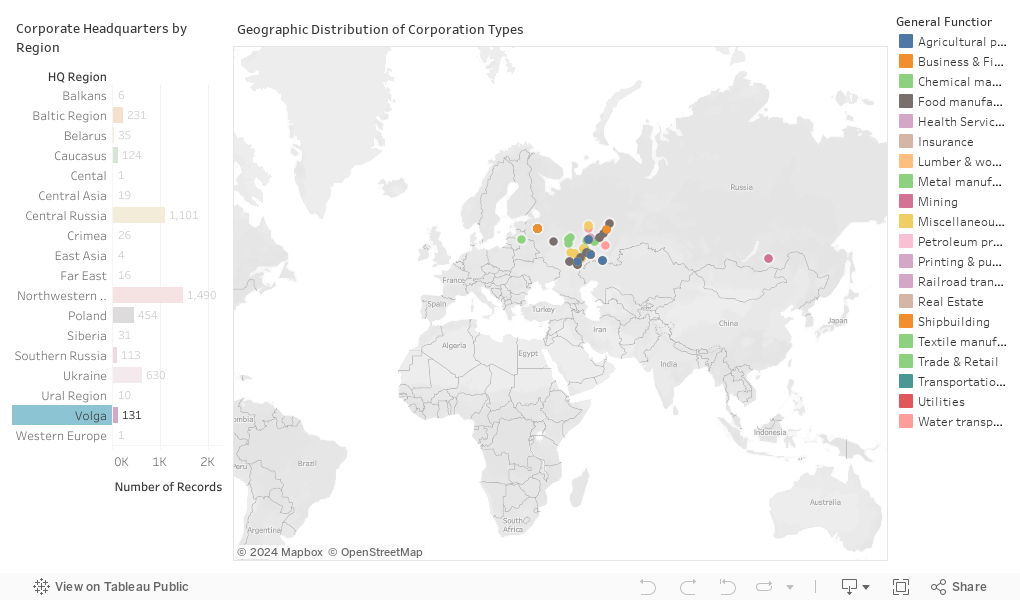
Unsurprisingly, the majority of Russian corporate headquarters existed within the regions of Central and Northwestern Russia, based around the empire’s largest cities of St. Petersburg and Moscow. Likewise, the somewhat sizable number of corporate headquarters in Ukraine is not unlikely, given Kiev’s historical significance as the site of the first Russian state. What is more intriguing is the level of corporate development in the Kingdom of Poland and the Baltic Region, given that these were not part of the original Russian Empire until its conquest of the Polish-Lithuanian Commonwealth in 1793.
However, this only provides information on corporate headquarters. For commercial and financial industries like banking, retail, trade, and the service sector, this information is likely sufficient, given that many of the operations of these companies took place in those regions. However, for extractive industries and manufacturing, a closer look into the location of operations gives a sense of the geographic distribution of investment.
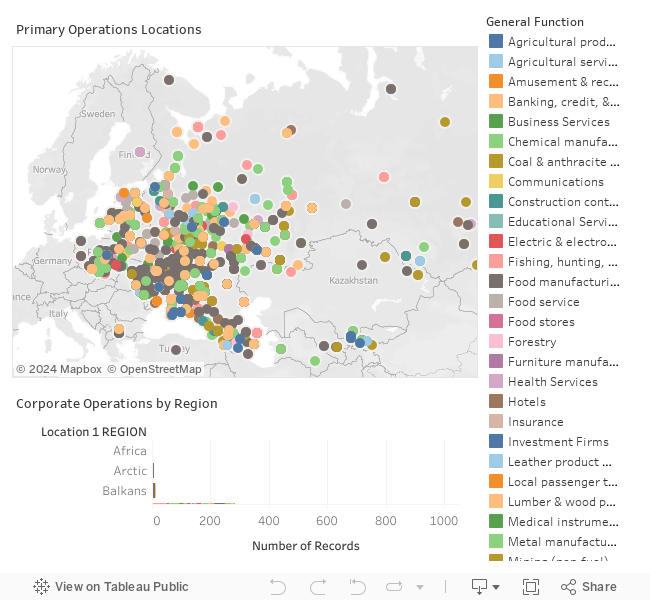
While this visualization suggests a majority of economic development in the Russian Heartland, it does highlight notable economic operations in the Baltic Region, Caucasus, Crimea, Poland, and Siberia. Furthermore, some of these regions became the site of industrial activities that were not widespread in the empire’s core.

As the graph above indicates, certain regions were dominated by particular industries. One noteworthy case involves Petroleum extraction and manufacturing in the Caucasus. 85 corporations with petroleum extraction and manufacturing as their primary function developed operations in this region, surpassing development of this type in any other region. Likewise, the Baltic Region became a center for the manufacture and operation of water transportation, notably shipbuilding. This region contained the largest number of corporate operations in this field, with 47 separate corporations conducting business in the area. This likely came as a result of the availability of warm-water ports accessible year-round, a feature notably absent in much of the Russian Empire. The Volga Region comes in at a close second, with 39 corporations engaged in the manufacture and operation of water transport. Again, this can likely be attributed to the geography of the region, with the Volga River serving as an important transportation route in the Russian interior.
Examples such as these highlight the diversity of natural resources across the vast Russian Empire, indicating substantial value of lands beyond Central and Northwestern Russia.
Next Steps: I am planning to include a section on levels of available capital (noted on the map below), measuring degrees of financial investment in these regions beyond the Russian core. I am also planning to include a temporal element, either in its own section or within the previous maps/graphs; I am currently working on figuring out the best way to do so.
I am also working on solidifying my argument, which will be noted in the introduction. I have outlined my research questions, but need to analyze the data further to bring my argument to a close. I am aware of this dynamic and should have it completed within the week.

One Comment
Maeve Kane
In your first dashboard with the geographic distributions of corporation types, you’ve got a conflict between the colors of your bar graph on the left and the industry types on the right. It’s not immediately apparent that the two color sets don’t correlate; you should change your bar graph to a single color, since the color differences between regions don’t convey any information. It’s also difficult to tell your industry types apart because there’s so many of them and the colors repeat–generally, 20 is the upper limit of what human eyeballs can keep apart. You’ve got three “miscellaneous” categories–can those be combined? Does grouping forestry and lumber/wood manufacturing make sense? You can group things in Tableau by ctrl-click to select several, then right click > group. The group names are editable.
Since you’re building off someone else’s data, it would be helpful to see a brief discussion of how your argument differs from the scholar who pulled the data together.
The geographic distribution discussion is interesting and I’d like to see more of it, with some additional context–eg, what does “site of the first Russian state” mean for a non-Russianist? You don’t mention anywhere what the temporal range of your data is and what that has to do with Poland-Lithuania 1793–give the reader more sign posts for how your data relates to your chronology. What’s the relationship between the Russian heartland and the other regions like Crimea and the Arctic that you discuss further down? Give more context for your data.
You’ve also got some locations like the Myndyck Sugar Co which are grouped in Ukraine but show up on the map in modern and historical Poland–are these errors? It’s also not clear to me if your bar graph and the first map are showing the same thing or if there’s something up with your filter: Your bar graph shows 10 firms in the Urals but the map only shows 4,.
Your second dashboard is laid out for mobile–make sure you use a layout for desktop so everything’s not squashed.
Some kind of sorting for the bar graphs in both the first and second dashboards would be helpful to highlight where the significant regions are. Hovering over the axis on the bar graph sheet should get you a sort icon. The bar graph in the second dashboard should either be moved alongside the color legend so that the graph is fully displayed, or flipped horizontal and left along the bottom so it’s fully displayed.
For your discussion of headquarters vs operations, it would be helpful to see you break out some filtered maps of eg banking vs extractive industries to better illustrate your point about distribution. Is there a way for you to show firms with operations in other regions vs firms with operations only in their own regions by industry? I’m thinking something like a treemap or bubblemap with HG vs Location 1, colored by industry, to see if there’s a difference in industries that stay in the same region as the HQ vs those industries where there’s more operations outside the region of the HQ. This could help you tell if operations development outside the central/northwestern Russian areas are neverthless connected to development in central/northwestern Russia.
I’d like to see you do an additional version of the operations by region bar graph with percent of total rather than absolute number of firms (right click number of records > Percent of total > compute using > table across). You’ve got relatively few insurance firms, but they’re a significant percent of the firms in Crimea; it’s also a bit surprising that so many of the western Asia firms are trade & retail.
It would also be helpful to have a simple visualization of change over time–you’ve got big spikes in founding dates at 1873, 1899, and 1912-1913–why is that? There’s also a corresponding big dip between 1899 and 1912–what’s going on there? Is there a variance in what regions have more foundings over time? And what’s the correlation between capital and operation region? A quick drop of capital onto your operations map shows railroads in outer regions as having more capital than almost anything else–are there any other interesting patterns there?