A Cartogram is generally speaking a map used to represent quantitative data, the representation of which exaggerates specific portions of the map presented in an effort represented greater and smaller amount of whatever is being measured.
This image for instance represents the distribution of Walmarts, McDonalds and Starbucks respectively. The larger the presence (in this case franchise locations)in a specific state the larger that state appears. It’s important to understand when working with Cartograms that they DO NOT accurately portray the geography of the location instead showing the quantitative data in a representative image. Cartograms allow for inferences about population sizes, and are an excellent tool for the representation of quantitative information in a geographic area. (Image from http://www.stephabegg.com/home/projects/cartograms)
Histograms, unlike Cartograms are simply the accurately displayed numerical data in a linear fashion. A histogram is designed to display information in a comparative fashion, allowing inferences to be made on numerical data. While similar to a bar graph, a histogram displays quantitative information instead of categorical and the bars of a histogram do not touch.
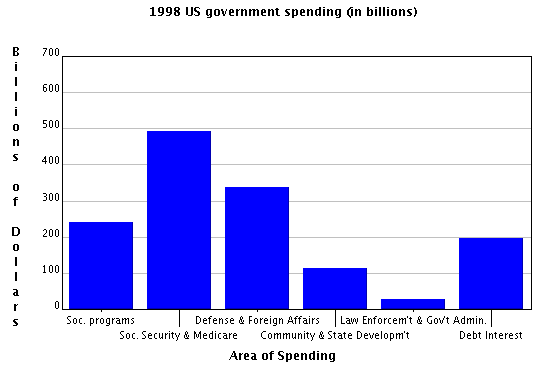
This histogram displays government spending, allowing for the comparison of funding distribution showing which areas receive more funding then others. Information displayed in this manner is useful especially in making cases regarding funding, comparing spending between categories gives us the ability to compare information in a way in which arguments can be made. For instance the highest spending categories are Social Security and Defense, while Law Enforcement and State Development are the lowest showing us where priority is placed in the budget. (From http://www.shodor.org/interactivate/discussions/HistogramsVsBarGraph/)