
The Proposal
Public History is moving at a breakneck pace with the constant improvements and different forms of technology changing the landscape of how historians interact with the public. A perfect example of this would be the social media site “reddit” where users can make submissions or posts and other users can comment, like, or dislike their submission. These posts are contained within communities or “subreddits” where there is community guidelines and rules, and are framed around a certain topic or idea. One of these subreddits was a project by historians to answer questions posed by the public; AskHistorians.
AskHistorians is a subreddit where anyone with a reddit account can ask questions and anyone can answer. The solution to prevent “bad” answers or as the community describes it unsubstantiated answers is through a variety of systems and rules. The main system is the flair system, where a member who answers questions on the subreddit can have a special name added to their username highlighting that they are a historian of some capacity and their field. The other systems are heavy moderation, sourcing, and peer review, all systems used in more traditional fields. All these systems have created a thriving community of both professional and amateur historians on one side and the public on the other.
The AskHistorian community has been successful since its inception and has seen great growth and user interaction, with monthly unique visitors hovering at 1.5 million. At writing the community has 928,000 subscribers (users who follow the subreddit on their account) and around 400 flaired historians. Through 2018 there was around 4,700 submissions per month or 157 questions each day. A portion of those are deleted due to not following the rules at around a rate of 30%. With these numbers we can draw a question of how, when, and what the “public” is curious about. Although the community is not overall a great example of the public at large, it does represent a certain, digital demographic.
The project aims to discover trend lines throughout the period of late 2016 to 2019 through the title submissions of the posts on the subreddit. Using the Library of Congress Subject Heading as a guidebook to classify the titles to then be able to use visualization tools to represent the data for better ease of use. The best visualization tool will be a stream graph that will be interactable and with the ability to filter the topics. Once deciphered and visualized it may be imperative to pick certain topics that seem out of place and try to correlate the reason why certain topics or trends occurred. An example would be if World War II questions occur more around certain anniversaries, such as Pearl Harbor. The tool and project will lend itself to help historians and the public themselves, know what questions get asked as a way to understand where research or exhibits should explored.
The Dataset
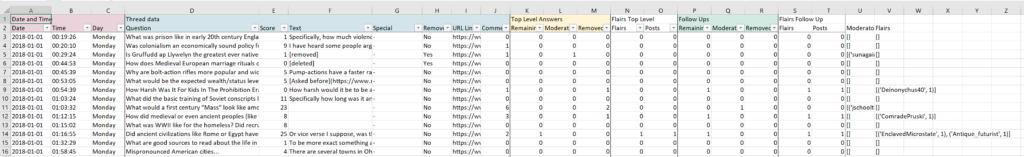
The data set is a scrapped database of thread data of the subreddit. The data set was provided to me after asking the de facto Head Moderator “Georgy_K_Zhukov,” a lecturer at George Washington University, for the data set. The data set was compiled by “Terminus-Trantor” another moderator of the subreddit. The data set is 27 separate files with multiple sheets each. Each file was a set month during the 2016-2018 period. Included in each is a summary of the month, the thread data, user activity, mod activity, gold list, and scriptlogs for the scrapping.
The relevant sheet is the thread data for this project which includes the data and time of the thread, the thread title or question, the score of upvotes/downvotes on the thread, the text of thread submitted by the author, number of comments, if the thread was removed/deleted, and metadata information about the comments made on the thread. The thread title is the most relevant column, however it is made by users submitting the question. The large amount of work will be “cleaning” the column and sorting it and classifying the thread title to a usable metric.
The other relevant column may be the thread totals of likes/dislikes which could show how certain topics are more popular than others. For example placing the top ten most popular of each month and see the visualization of that trend. This may be explored further once the cleaning of the thread titles is complete.
Outlines
Milestones:
- April 5th: 2018 Data Cleaning and Sorting Complete
- April 9th: Wireframe of 2018
- April 19th: All Data Cleaning and Sorting Complete
- April 29th: Mockup of Visualization: Stream Graph
- May 5th: Initial Visualizations Complete
- May 12th: Additional Stretch Goal Visualizations
- May 16th: Final Submission
Data Visualizations:
- Stream Graph of Thread Titles by Submission Date
- Bar Chart of Topic Totals.
- Additional Visualizations to be determined.
Sources:
- Kris Wood. Historians on Reddit? History News Network. 14 January 2013.
- Sadie Bergen. Have a Question about the past? AskHistorians! Perspectives on History, Feb 2016
- Sarah Ann Gilbert. Motivations for Participating in Online Initiatives : Exploring Motivations Across Initiative Types. University of British Columbia, 2018
One Comment
Maeve Kane
You don’t need to quote Reddit or subreddit; you can assume that most readers will know what these are (though Reddit should be capitalized if referring to the main site). You’re going to have to balance your context in speaking to both an audience of your peers in class and, I assume, aiming this at an audience on the subreddit itself. I don’t think you need to be as defensive as this proposal sounds about how representative or not the “public” represented by r/AskHistorians is–any group is by definition not going to be totally representative of the Big Public. If available, some demographic numbers about Reddit itself may be helpful for context, but not necessary.
You’ve got a lot of passive voice here, and some unclear semicolon and comma placement issues. Especially if this is aimed at a reddit audience, you can put more you in the writing, it doesn’t have to be abstract third.
For cleaning the thread titles, are you changing the data or adding another column with new categorization information? You should be adding rather than changing, so that you have the original in case you need it down the line.
Topic modeling like we did with the slave narratives will do a lot of the topic analysis work you want to do with LOC categories with much less work.