Project Review: Canals 1820-1860
Canals 1820-1860 is an interactive map that shows the overtime construction of canals in antebellum America. Drawing from primary sources and histories, Canals 1820-1860 aims to show the importance of America’s canal system to the development of a shared “Northern” identity.
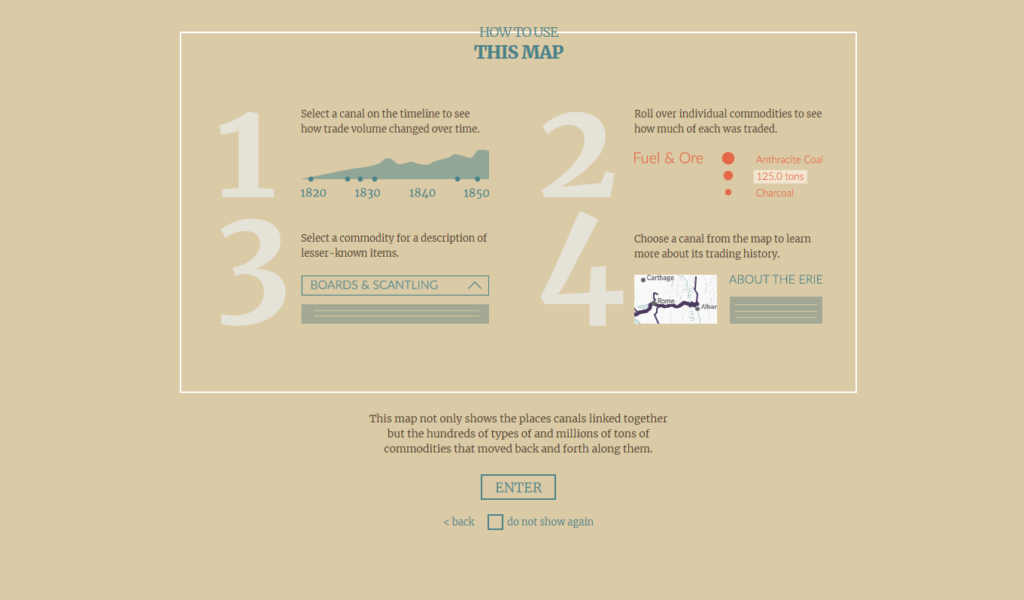
Realizing how daunting their map can seem to people, an optional “How to” is provided to guide users through the process of analyzing information for all canals or individual ones. This was a welcome sight to see because all too often, databases, projects, etc. are excited to share their research for audiences but fail to acknowledge how foreign someone can feel when presented with information they may not be familiar with. A simple how-to such as this one, gives a user a certain peace of mind. There is nothing like entering a site and having questions but no one to ask.
Upon entering the actual map of canals, I was able to quickly learn how to navigate it. The sliding timeline on the bottom is convenient for two reasons. The first is because we can see the growth of America’s canal system connecting population centers across the northeast. As the bar is slid across the timeline, the map adds canals in real time. Secondly, someone that is unfamiliar with any one canal route can easily see if/where one may be located in respect to their own location.
To the left of the timeline, a scrolling list allows for any canal to be selected. Unfortunately, while the map will zoom in to the location of your selected canal, it will not provide its history or commodity information unless you use the timeline slider to select certain dates. Since I grew up along arguably the most important canal, I will look at the Erie Canal.
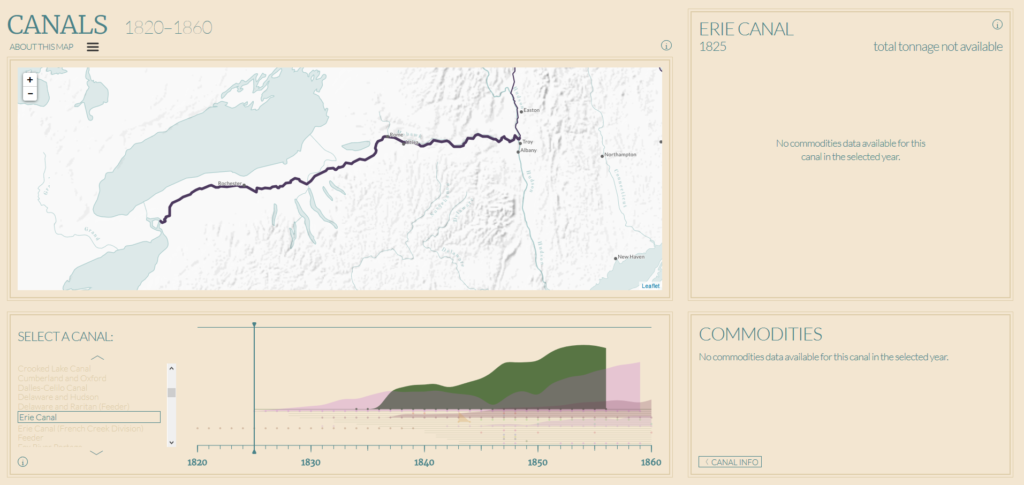
The Erie Canal opened in 1825, connecting Lake Erie with the Hudson River. Never before, goods and services could now travel from the Atlantic Ocean to the Midwest in record time. Communities popped up all along the 350+mile length which can still be seen today, though in much rougher shape than in the 19th century. As you can see, there is no commodity information for 1825. But as you slide along the timeline, this changes. Canals 1820-1860 draws this information from annual reports from canal boards. By moving to 1854, we can see the largest total tonnage for the Erie Canal.
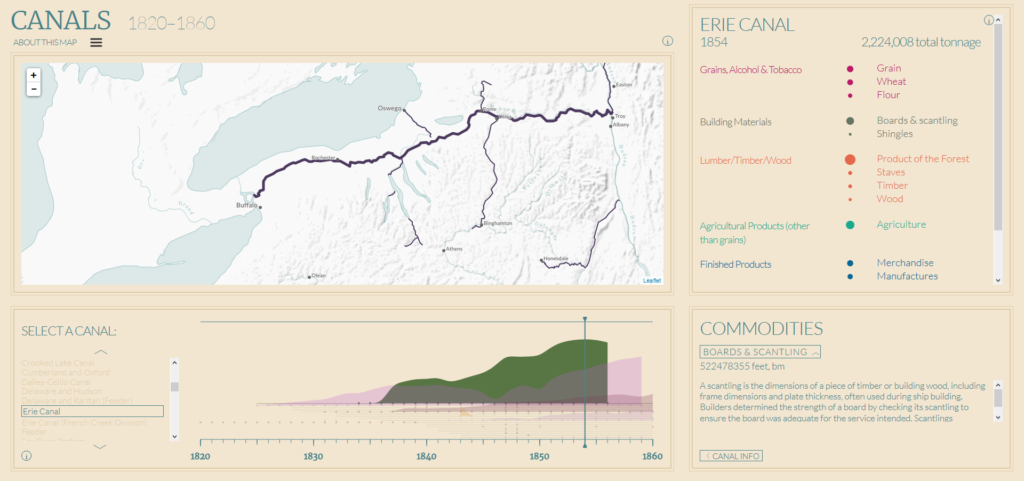
Here we can see over 2 million tons of goods traveled the Erie Canal in 1854. It is broken down into categories and when you hover over each item, the total tonnage is provided as well as a description for its use and importance to the economy. I believe this can be improved upon by adding the option to compare different years of a canal’s operation to fully understand its development. While this can be achieved by navigating the timeline, comparisons can be difficult since the information is not saved.
Overall, Canals 1820-1860 provides a useful resource for researchers to get an introduction to the history of canals in antebellum America. The site does a great job of giving a simple interactive experience but fails to peel away the layers of history and instead gives a table of contents, if you will. Serious researchers will find the map useful but will not gain much insight they can find elsewhere. It is for this reason, Canals 1820-1860 is best suited for the average user that needs a place to start in their research.
Canals 1820-1860. https://dsl.richmond.edu/panorama/canals/#canal=22&year=1849&loc=9/0.9558/17.6495. Created and maintained by the Digital Scholarship Lab. Reviewed Feb. 3-Feb. 5 2019.
2 Comments
Maeve Kane
How do you think this project compared to the other one you reviewed in terms of ease of navigation and accessibility?
John Epp
Without a doubt, this one is easier in terms of navigation and accessibility. It isn’t trying to be fancy with its data by creating spiderwebs of information like Viral Texts.