Wire Frame International Pirate Trials
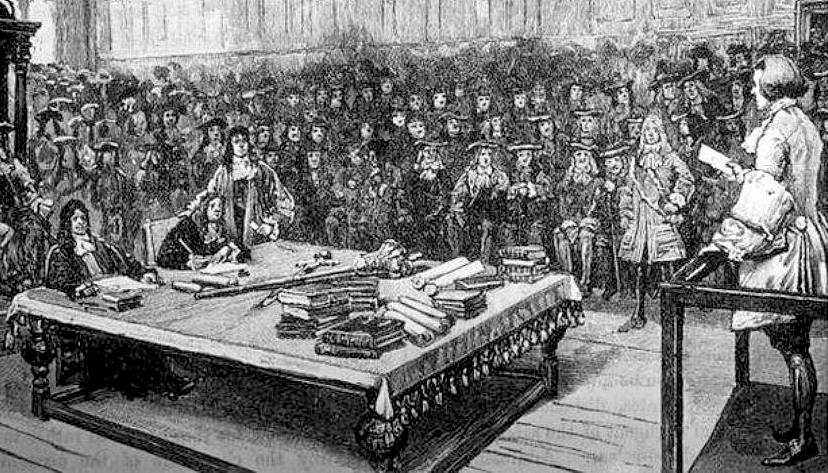
Image of the trial of Captain Kidd, 1701. Retrieved from bluebird-electric.net
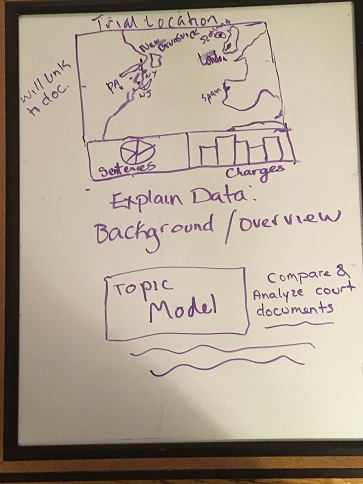
The Dashboard will be used to provide general information about the trials and give some context and background about trying piracy at this time. The map will show where trials took place and will link to corresponding court documents. The pie chart will breakdown the different sentences, i.e. death, acquittal, pardon, etc., in percentages. Finally the bar graph will show how many were tried for more than just piracy. Those charged with piracy were also often, but not always, charged with other crimes such as murder or robbery (which is interesting because at least robbery seems like an essential part of the definition of piracy but often they were separated).
The topic model will be used to analyze and compare the different ways pirates were tried and the arguments for and against conviction. This may be broken down further to better understand the difference between countries or time periods if the data seems support this idea.
Finally, I will include a section that explains how I gathered the data and why I made the decisions I did. Since I created the data set I think it is important to explain my thinking behind my choices and why some documents from this collection were used and others omitted.
One Comment
Maeve Kane
Do you have any that were charged with piracy but not robbery? What’s defining piracy?