Wireframe: Gender and England’s Immigrants 1330-1550
This project will explore the different experiences faced by men and women while immigrating to England as demonstrated through the data set England’s Immigrants 1330-1550.
The post will begin with an interactive map of where the immigrants came from and what percentage of each gender immigrated. The graph will be formatted so when a location, for example Scotland, is clicked a double bar chart will appear demonstrating the percentage of male and female immigrants from the selected country. The map will be accompanied by text underneath which gives an explanation as to why people were immigrating during this time (ex. the Plague, Hundred Years War, etc.).
Next will be a graph done in the American Panorama style which will show the difference in occupation of men and women. The Dashboard will have a map and when clicked on, it will show a chart of the different percentages of men and women represented in each profession, for example a servant or a tailor. It will also demonstrate general differences overall, so the difference in gender representation in each profession in terms of gender overall, not just from one country.
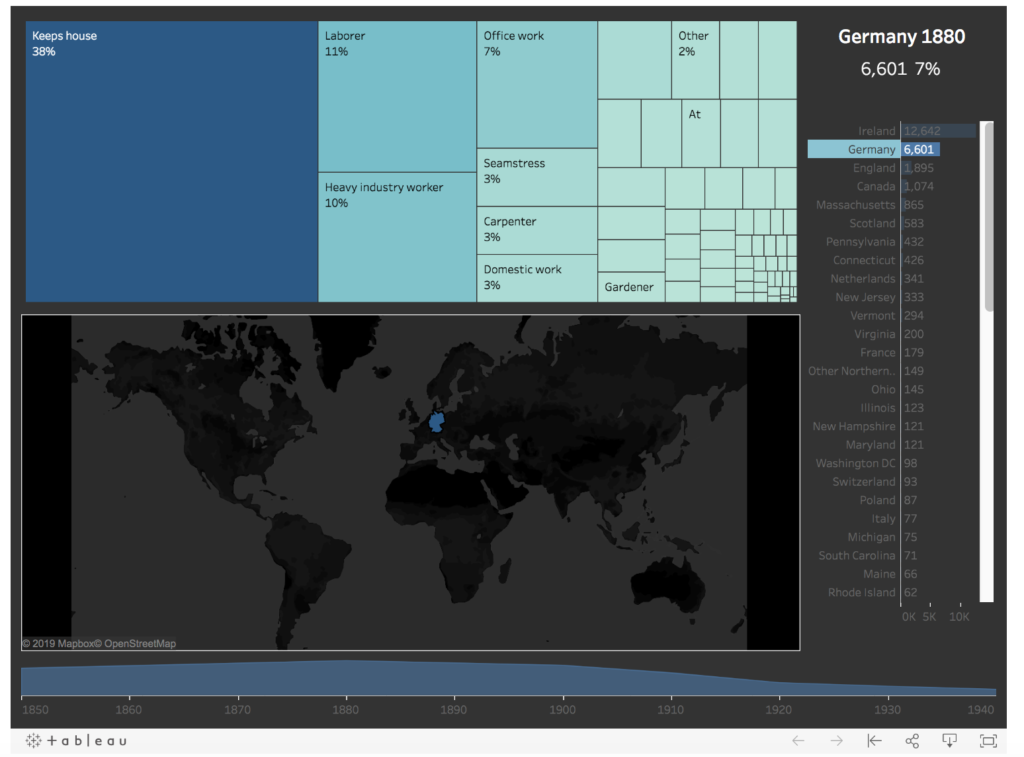
Underneath will be a text explaining the reasoning as to why men and women entered different professions at different rates. It will also include brief biographies of one man and one woman who immigrated during this time.
Twine will be used in order to demonstrate the different experience of the immigrants due to gender, for example, the different opportunities available to him or her, such as the likelihood of a woman becoming a servant versus a man who could become a tradesmen or involved in the church, etc.
One Comment
Maeve Kane
For your text commentary on why people I’m migrated, you’ll need to make another spreadsheet formatted like this:
Year Country Text
You’ll need to do another sheet like this for your example man and woman. Be a bit cautious about your numbers–you’ve only got people who showed up in the records for some reason, and women didn’t often show up in the records for this period, so you likely don’t have all the women who immigrated or who were in a particular trade. Not a reason not to do this, but something to note in your discussion.
How are you planning on integrating the Twine and dashboard portions of the project? The way you’re discussing them now, they sound like two entirely separate projects.