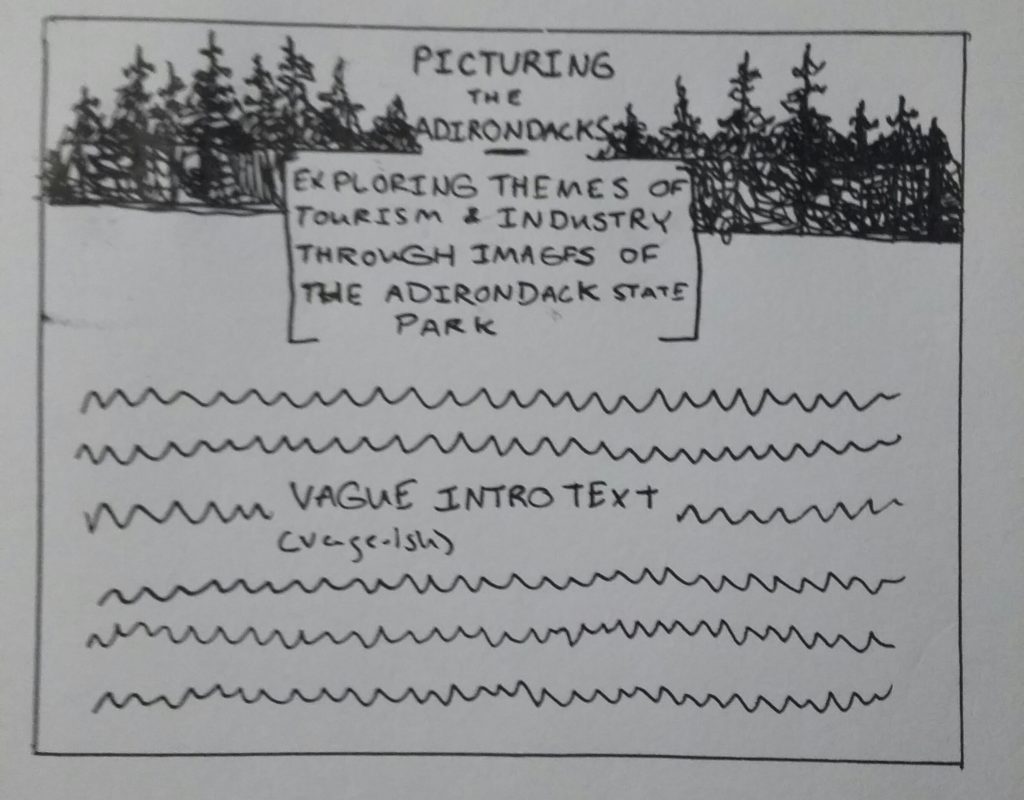
Wireframe: Picturing the Adirondacks
For my project, I hope to code my own web page. I’d like to explore more of the design elements that we touched on in the beginning of the semester.
I thought the way in which the project “American Panorama: the Overland Trails” opened their project was interesting, and I would like to incorporate a similar element into my own. Upon arriving on the page for the Overland Trails project, a dialogue box explaining the basic context of the project and how to approach the visualization appeared.
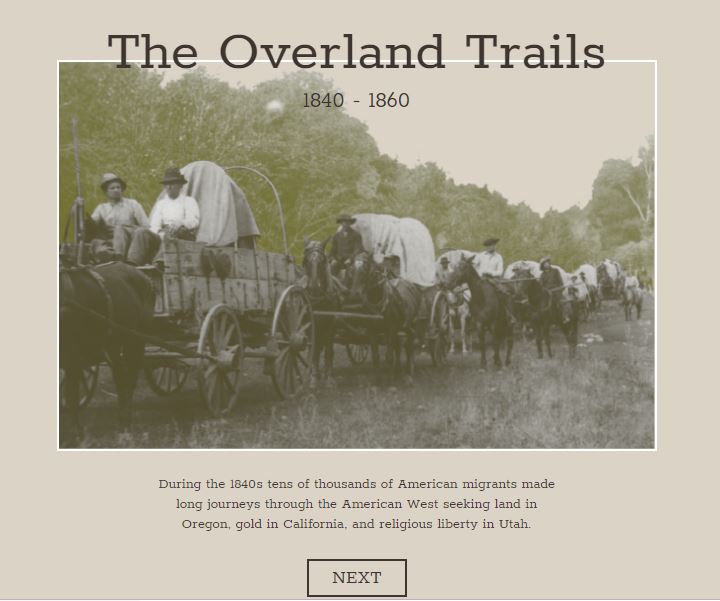
Because I would like to eventually make this a public history project, I think having this basic introduction could be advantageous. The text could explain the basic concept of the project (ex: “the perception of the Adirondack Park has shifted over the years…Exploring images of the region is a way of re-examining these narratives…etc).
After clicking out of this, the viewer would be brought to the main page.
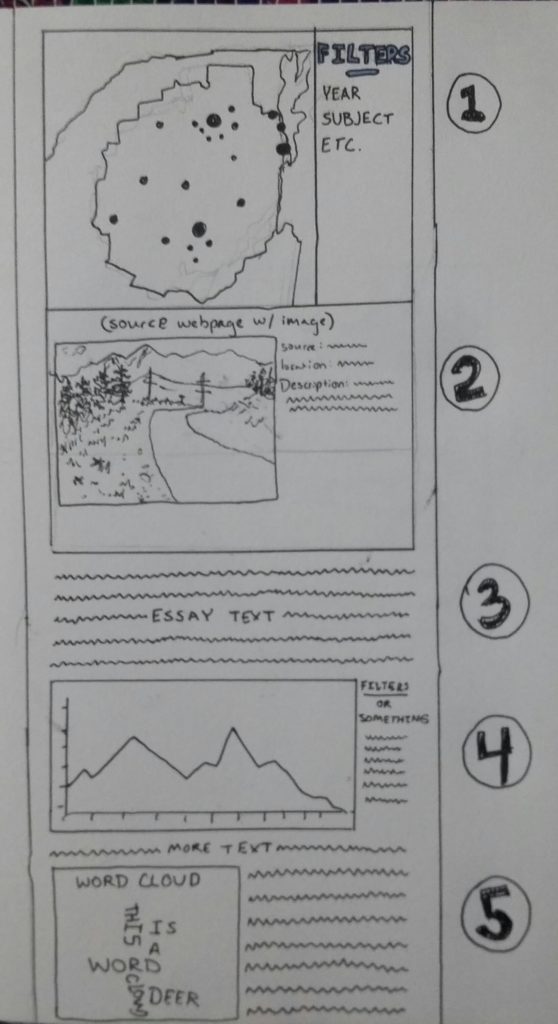
1: Map of the Adirondacks
This map will include markers that show the location in which each image was captured. It will be filterable by factors such as city, county, artist, collection, and medium.
2: The Images and their Source Pages
This block will be connected to the map visualization. Once clicking on a dot, which represents a specific image, the page from which the image was retrieved will be displayed here.
3: Essay Text
This portion of the essay text will explore the changing perceptions of the Adirondacks and how the images shown help us see this narrative. Specifically, I will focus on how ideas of wilderness were changing, as well as demand for lumber, iron, and other materials.
4: Line Graph
The line graph will demonstrate whether or not there are distinct shifts in the subjects of the images.
5: Word Cloud and More Text
The word cloud will be generated using any descriptive text provided for the images. This will be another useful tool for interpreting the story of the Adirondacks. It will hopefully show more specifically what was being discussed in the images (wildlife, geology, botany, sanatoriums, etc). The text following with will link ideas generated by the word cloud with those from the other visualizations.
One Comment
Maeve Kane
For your word cloud, you’re going to need to create a separate text file for voyant to use, and multiple text files if you want to compare different years.
Depending on how complicated you want to get with writing the webpage from scratch, you could use an HTML/css framework like bootstrap: https://getbootstrap.com/docs/4.3/content/reboot/. That link looks very complicated, but what it does, is if you name your HTML pieces a certain way and include their css sheet, it will style things for you and do fancy things like give you different kinds of popups. You can do what you’re describing by writing by hand, but the trade off of learning a framework is doing some fancier stuff.