Mapping Great Lakes Shipwrecks Wire Frame
This project is mapping the wrecks of the Great Lakes. For the purposes of this project, a shipwreck is a vessel that has experienced an incident that has placed it out of commission. Because of the incident logged within, the vessel never sailed on its own again. This can mean the ship was sunk, or damaged beyond ability to repair and return to service.
Wreck Page
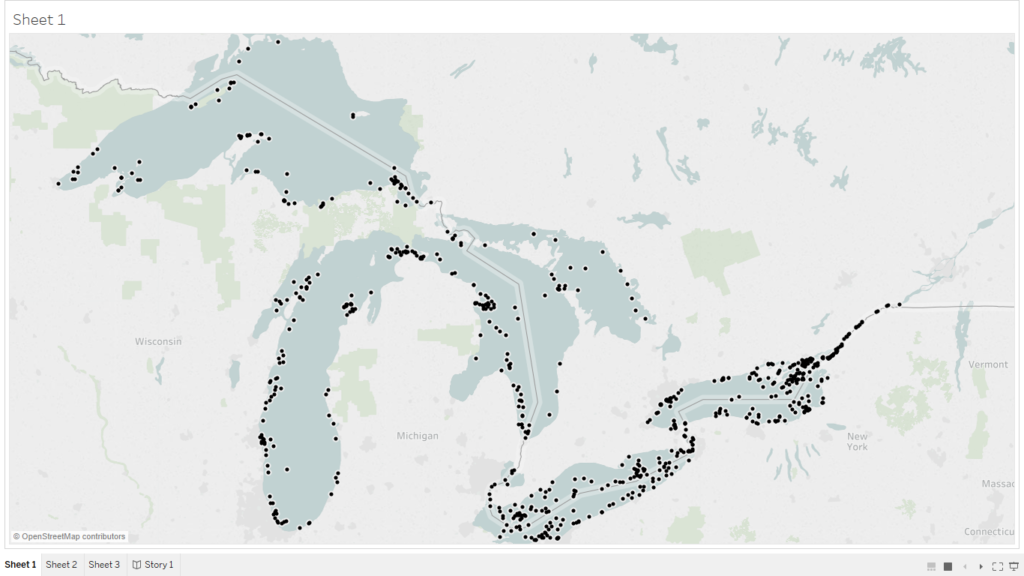
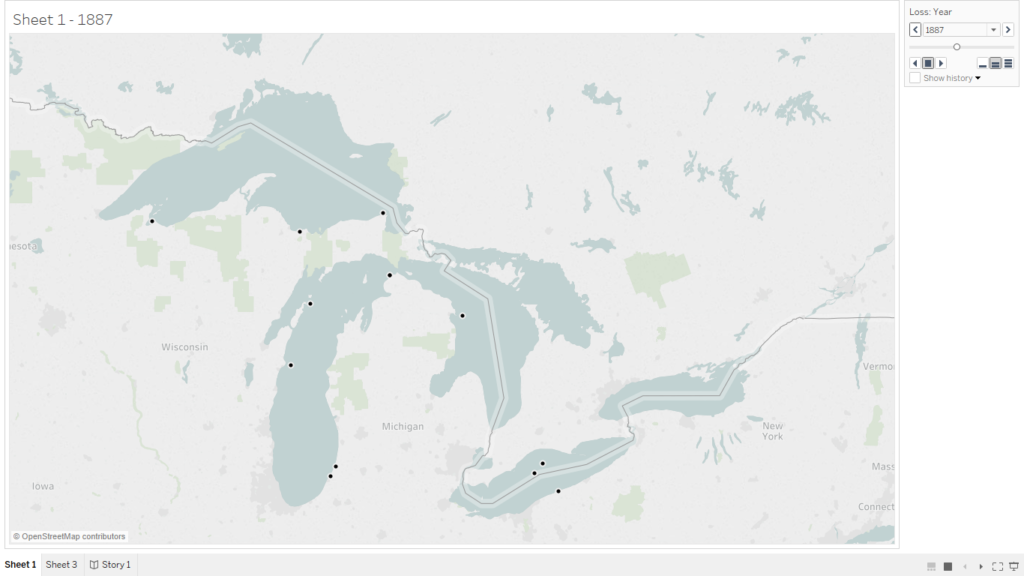
The primary interactive map will include a map of wrecks with the ability to view them as a whole or run them by loss year in a video. I can also color code the wrecks between accidental wrecks and ones that were scuttled or abandoned.
Build Page
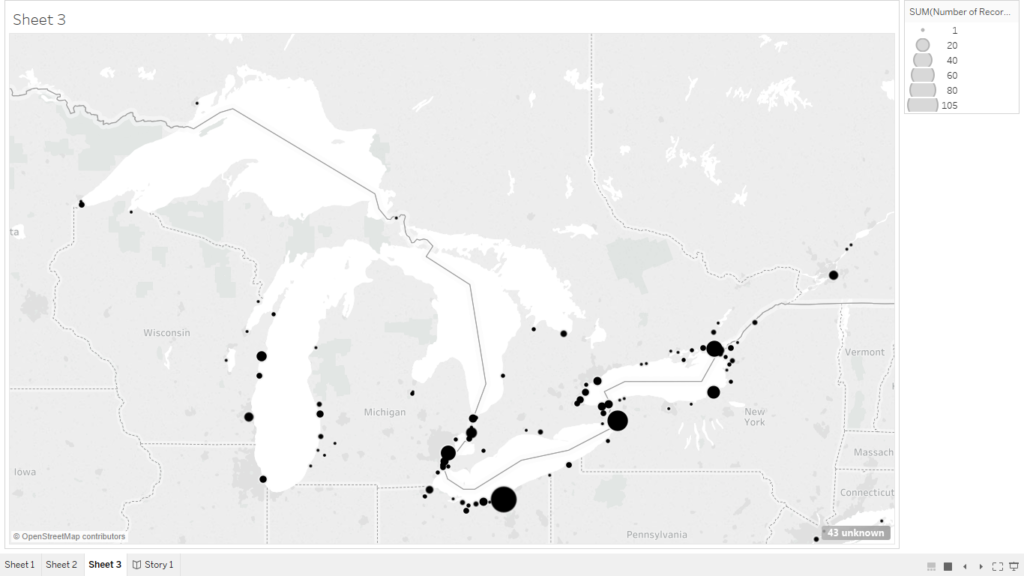
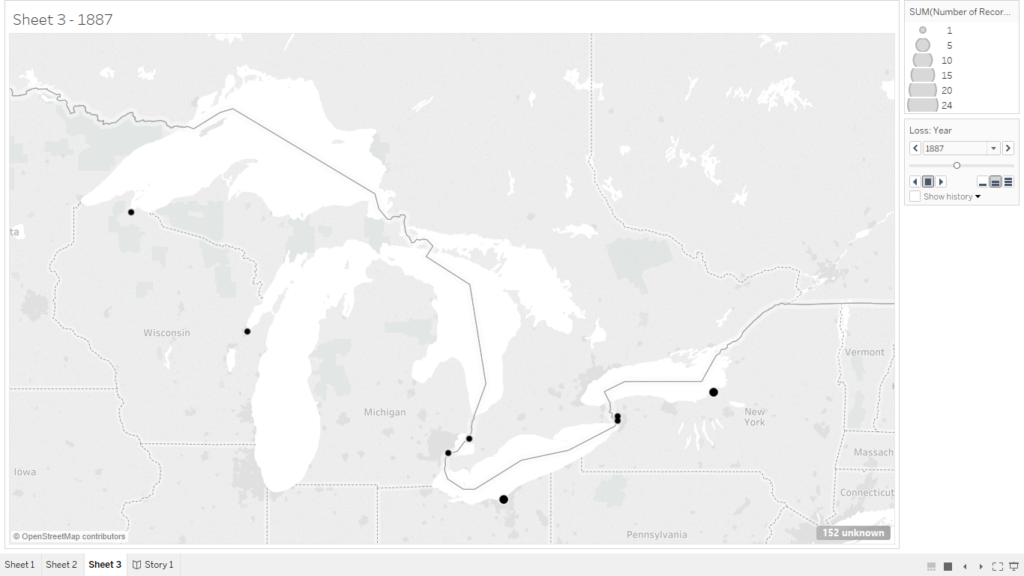
The second page is a map of the build locations of the wrecks. Like the wrecks page, there will be the ability to view as an overall page or as a video by year
One Comment
Maeve Kane
You should investigate Tableau’s bin function for grouping the wrecks by 5 or 10 year periods, since especially for your earlier years there’s not as many year by year.
Please post an embed of your working file so I can see how a couple of things are set up.
So what’s the plan of how the reader is going to be guided through each part of this? What’s the structural outline of the argument, and what pieces do you need to build or put together to show it?