-
Who are Yankee Whalemen?

This project trace the development of the labor force of the American whaling industry over the nineteenth century. Using the New Bedford whaling crew list database as a data set and the use of network analysis and mapping this project reveals the racial and geographic makeup of the whaling crews. This project will be structured as an interactive dashboard with multiple visualizations that change based on the input of the reader. The data will be filtered by year which will be able to be changed by a drop-down menu at the top of the dashboard.
-
Wireframe feedback collab
For class today we’ll be collaborating to make a feedback form. One person in each group should open up the form to make edits.
-
Wireframe: Pittsfield Census Records
The structure of this project will be composed of a series of interlinked web pages utilizing the program Twine. The different pages are as follows: Introduction, 1920 Census, 1940 Census, Further Information/Reading List, and Future Project Goals.
Introduction Page
The Introduction page will have a large, centrally placed image of a ward map of Pittsfield, Massachusetts. Underneath the image, visitors to the site will be able to read the main argument of the project.
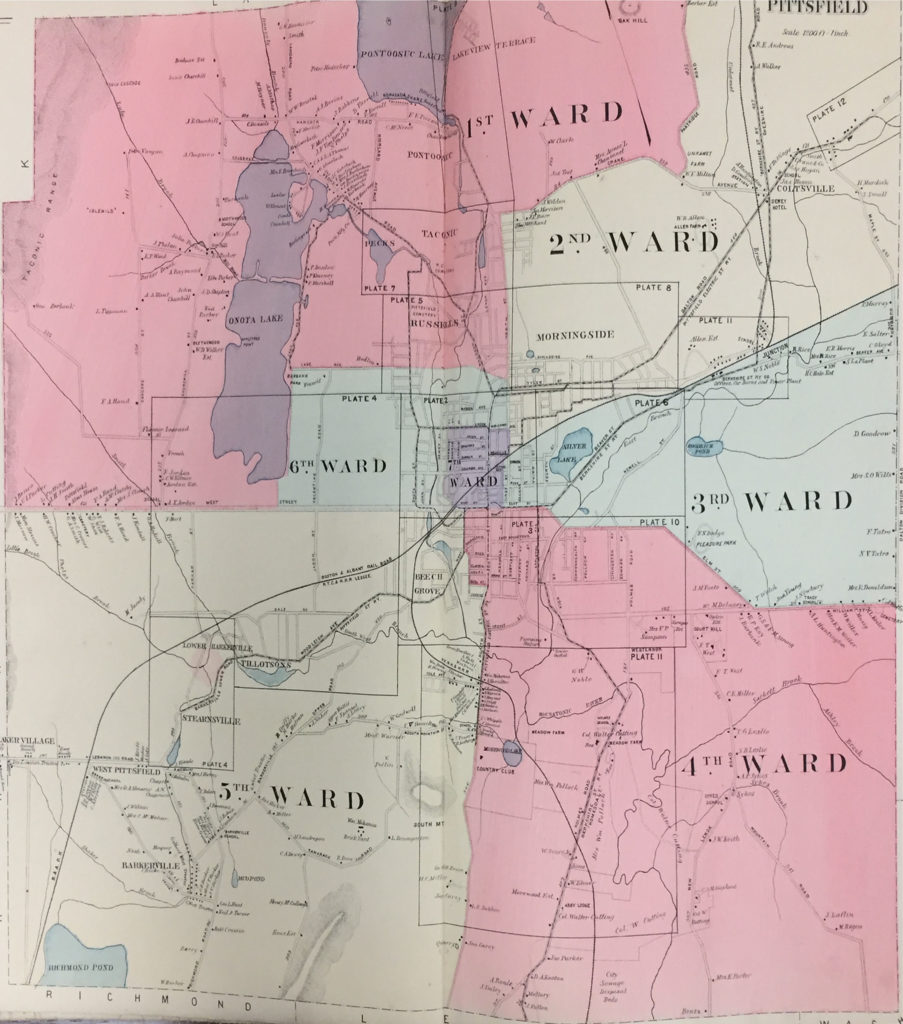
Introduction Map (1899) -
-
-
-
Final Proposal
Outline– My final project will trace the development of the labor force of the American whaling industry over the nineteenth century. Using the New Bedford whaling crew list database as a data set and the use of network analysis and mapping this project reveals the racial and geographic makeup of the whaling crews. There has been previous research revealing the cosmopolitan makeup of the New Bedford crews, by mapping residency, skin color, rank and other metrics this anecdotal evidence will become visually apparent. Further, running a network analysis upon a select number of ships and filtering by race and residency, patterns of the crew makeups become apparent. Mapping residency onto a globe will display the specific hubs form which American whale men came from. While a network analysis of a collection of select voyages will trace the unique stories of specific crews. The whalers who sailed from New Bedford are incredibly diverse, and many crews display specific makeups. This project will attempt to verify previously known crew patterns as well as reveal others.
-
Jack’s Shipwreck Project
Introduction
This dataset is a collection of data on shipwrecks in the Great Lakes. My project proposal is to complete a Tableau map and data analysis of the wrecks in Lake Ontario. So far, there are 313 wrecks in the dataset for Lake Ontario, with data on each along 76 different columns of information. Currently, I am data cleaning rows to update the information and add in LAT/LON information for mapping, there are about 20 rows left to clean. Along the way, more wrecks might yet be added to the Lake Ontario dataset as I consult updates to sources. I have already had to take out some wrecks that were erroneously recorded as in Lake Ontario, but which actually occurred elsewhere (F. A. Georger)…
-
Final Project Proposal: Internal Salve Trade
By Jesse Aragona
Data Critique- My project begins with a tweak in my initial Data Critique, analyzing how best to interpret and use the data provided for my research needs. Revisiting the issues with the data set will provide a clear and concise lens through which I can view the rest of the project.
Data Cleaning- The main focus as far as cleaning is two fold for this project, narrowing the scope of the data set excluding information irrelevant to the United States and using the original formatting to decipher categories lost in translation to Google sheets is absolutely necessary for the completion of this project.
Secondary Bibliography-
1)The Chattel Principle: Internal Slave Trades in the Americas by Walter Johnson
2)Quantitative Estimates of the United States Interregional Slave Trade, 1820-1860
3)Hidden in Plain Sight: Centering the Domestic Slave Trade in American Public History
4)Slave Trading in a New World: The Strategies of North American Slave Traders in the Age of Abolition
How closely can we trace the route from Africa to arrival at U.S. ports, and with how much accuracy can we find the final destinations of the enslaved? Did certain ships stick to certain routes, and if so how close can we come to obtaining national origins for the enslaved and their ancestors. How accurately can we map those journeys?
Goals- A map of voyages, hopefully expanding out from the initial port to separate destinations if possible. A cleaned representation of the data used, sheets provided representing the journeys and individuals shown on the map. Ideally the map will allow the reader to trace routes of individual voyages from the nation of origin to the point of departure, and further if more data can be adapted and used for that purpose. The project will also provide a significant explanation of the Internal United States Slave trade, including policies and methods.
Timeline- March 30th, Isolation of Data to be used as well as completed cleaning of said Data. April 3rd, rough draft of map as well as final data set exclusions and inclusions. April 9th, Rough Map of Voyages completed
-
Final Project Proposal
Data Critique
The two datasets I will be using for this project are rosters from the National Basketball Association and Major League Baseball five years after integration. The datasets primarily come from information from websites associated with sports reference. I was able to create datasets using this information to include information like the name of the player, age of the player, where they are from, what team they played on, and most importantly for this project their race. This includes data for each team from each league. As this dataset was made by me, I’m still considering adding more data if I find something else I want to explore with this project.
