-
End of term feedback
I take your feedback on this course very seriously! The university will have general course evals open later this week, but your feedback on some questions more specific to this class will be very helpful for me. Your name, email, or IP address is not recorded with this form, and I will not look at responses until after grades are submitted.
I would also appreciate your time identifying your classmates who have been the most helpful for you this semester. This form does ask for your name, but I will not identify anyone’s responses to anyone else in class. I will use your responses on this form for bumping up grades of anyone others in class found particularly helpful, but no one will be penalized based on these responses.
-
-
Dashboard Filters in Tableau
Here is my in-progress dashboard. As we briefly talked about in class, I’m trying to make the bar graph interactive with the map filters.

-
-
A post with footnotes
This demonstrates a post with footnotes.
This is my footnote with a bibliographically correct short citation, to be followed below by a bibliography. -
Shipwreck of the Week: Maitland (1871)
#Spaming the class with posts today, but I’m trying to be productive on my sick day. For the first wreck, I’m going to discuss the S/V Maitland: a three-masted barque sunk in a collision with two other ships!

“Two?!?” -
Wireframe: Albany Census Data
The main question this project asks is “Where were people in Albany coming from?” The biggest part of this project will be a map. I’ll break it down into each year on the census from 1850 to 1940. I would like to have a world map where a viewer can highlight a certain country or region and be able to see how many people were born in the selected area.
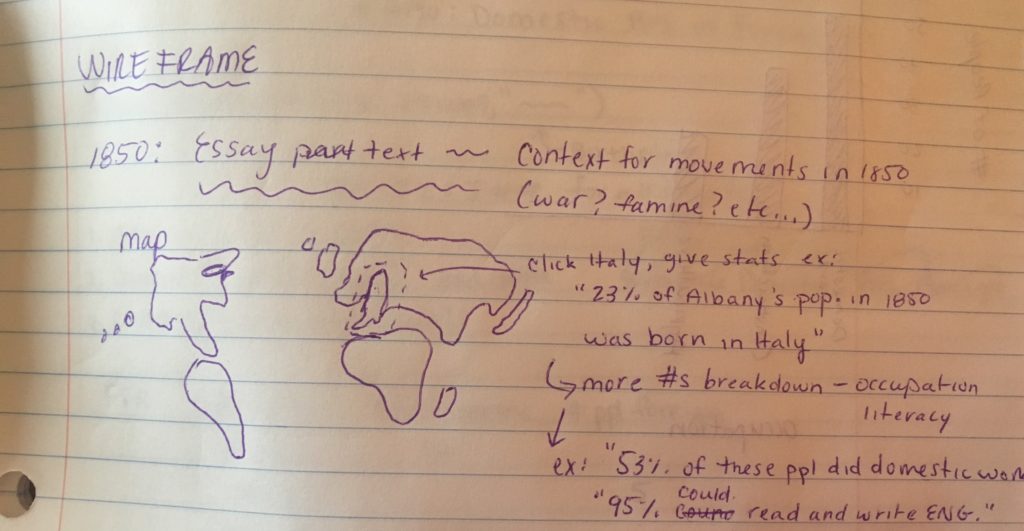
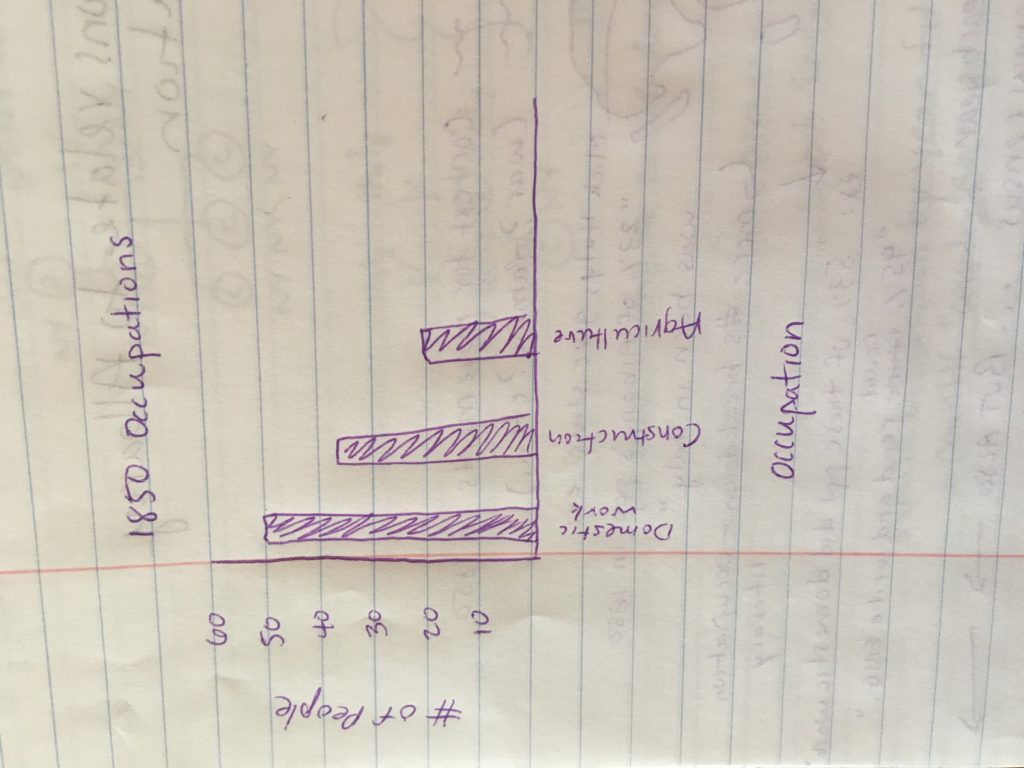
I would also like to show the information about people once they were in Albany such as literacy and occupation. I will probably do this using a graph to show different occupations and literacy rates. I think I will use both absolute numbers as well as percentages for this information, as well as the birthplaces of individuals.
There will be some essay text included. This will serve to add historical context to the movements of people to Albany from their birthplace. For example, political or social conflicts in certain regions in certain years.
-
Mapping Great Lakes Shipwrecks Progress Post
I have been chugging away on the project. This weekend, the main two things I worked on was data cleaning the build information to produce the Build Location map for the wireframe as well as continuing to add Latitude and Longitude to my entries.
-
Mapping Great Lakes Shipwrecks Wire Frame
This project is mapping the wrecks of the Great Lakes. For the purposes of this project, a shipwreck is a vessel that has experienced an incident that has placed it out of commission. Because of the incident logged within, the vessel never sailed on its own again. This can mean the ship was sunk, or damaged beyond ability to repair and return to service.
-
Wire frame Slave Trade
By Jesse Aragona
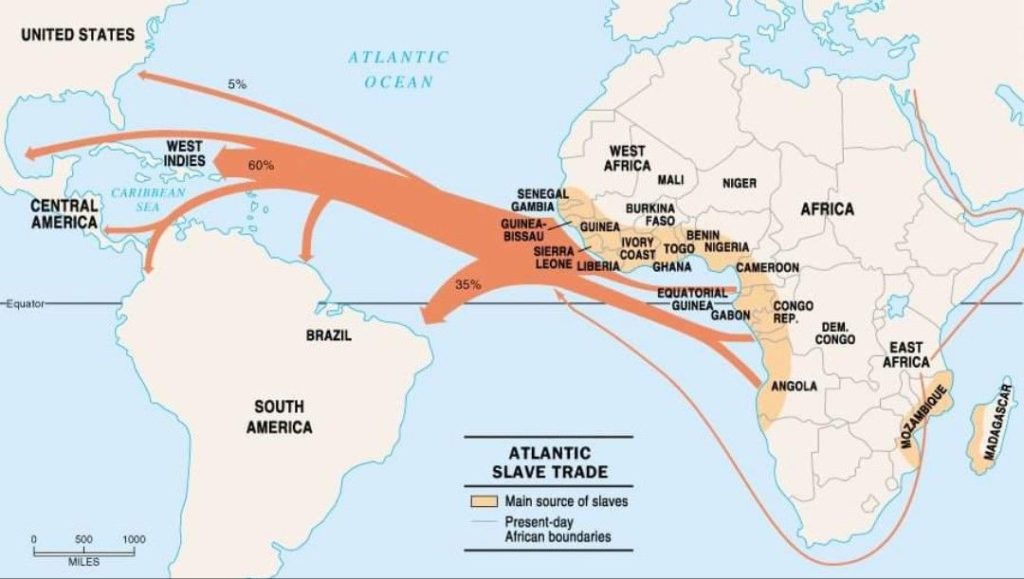
The main component of my project is my two maps, this map isn’t the product but a similar image from the internet. The finished products will be uploaded to a website. containing both the essay text broken down into both the Trans Atlantic and Internal Slave trades as well as chronicling and explaining the importance and impact of the voyages.
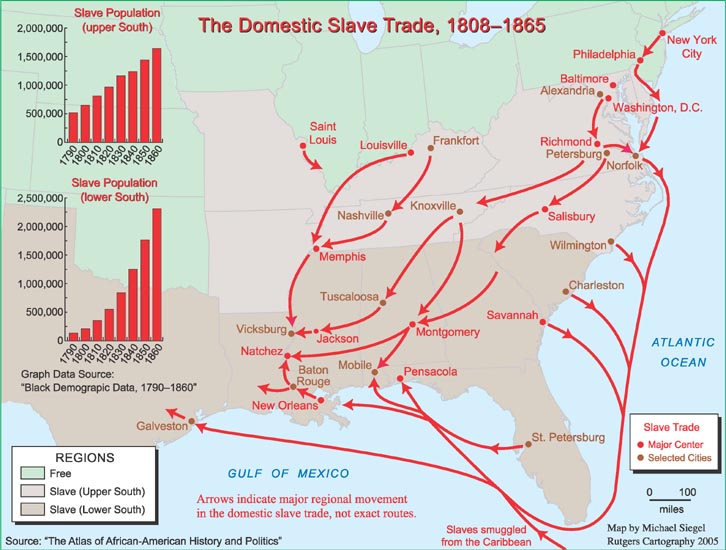
The main focus of my project is beyond just tracking the journeys but is an attempt to provide a link to where journeys began and ended, using the data set regarding both trades. The final project will also contain a revised table, featuring locations and the names of ships to trace the journeys.